AI Tutorial
Turn a Two-Hour Excel Task Into 10 Minutes With Claude in Excel
Learn how to use Claude in Excel to clean messy CSVs, organize spreadsheet data, and build a reusable reporting dashboard faster.
Share
In this walkthrough, you’ll complete a short exercise that teaches you how to use Claude as a spreadsheet architect. The goal is to take 5+ messy CSV files and let Claude turn them into something practical. From cleaning data to formatting tables and color-coding sheets, Claude handles most of the work.
Who This Helps
- Consultants whose clients rely heavily on spreadsheets
- Team leads who want cleaner, repeatable reporting across their organization
- The team’s “Excel person” who spends a month-end fixing formulas, formatting tables, and cleaning reports
What You’ll Create
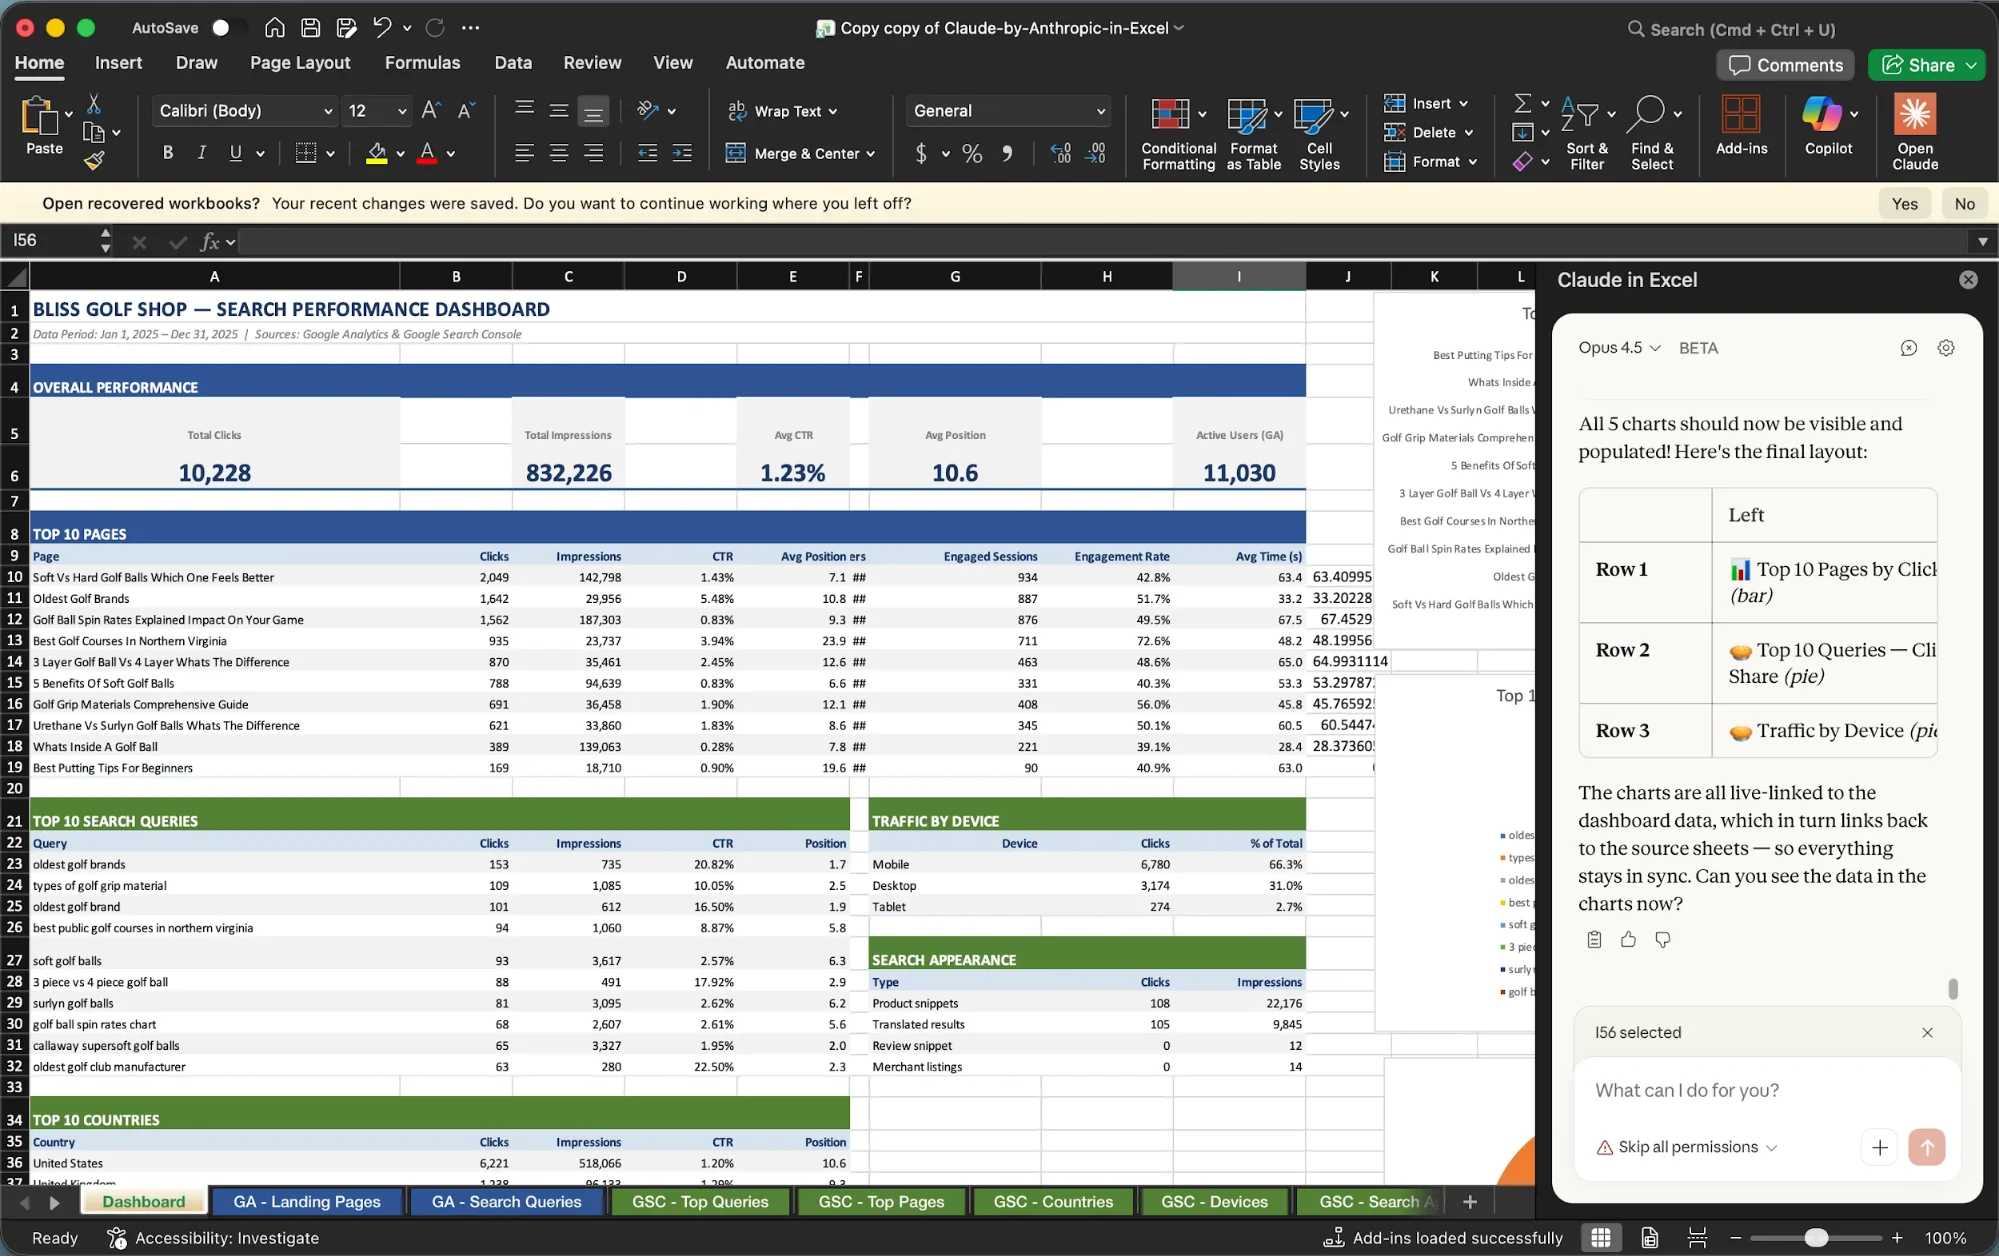
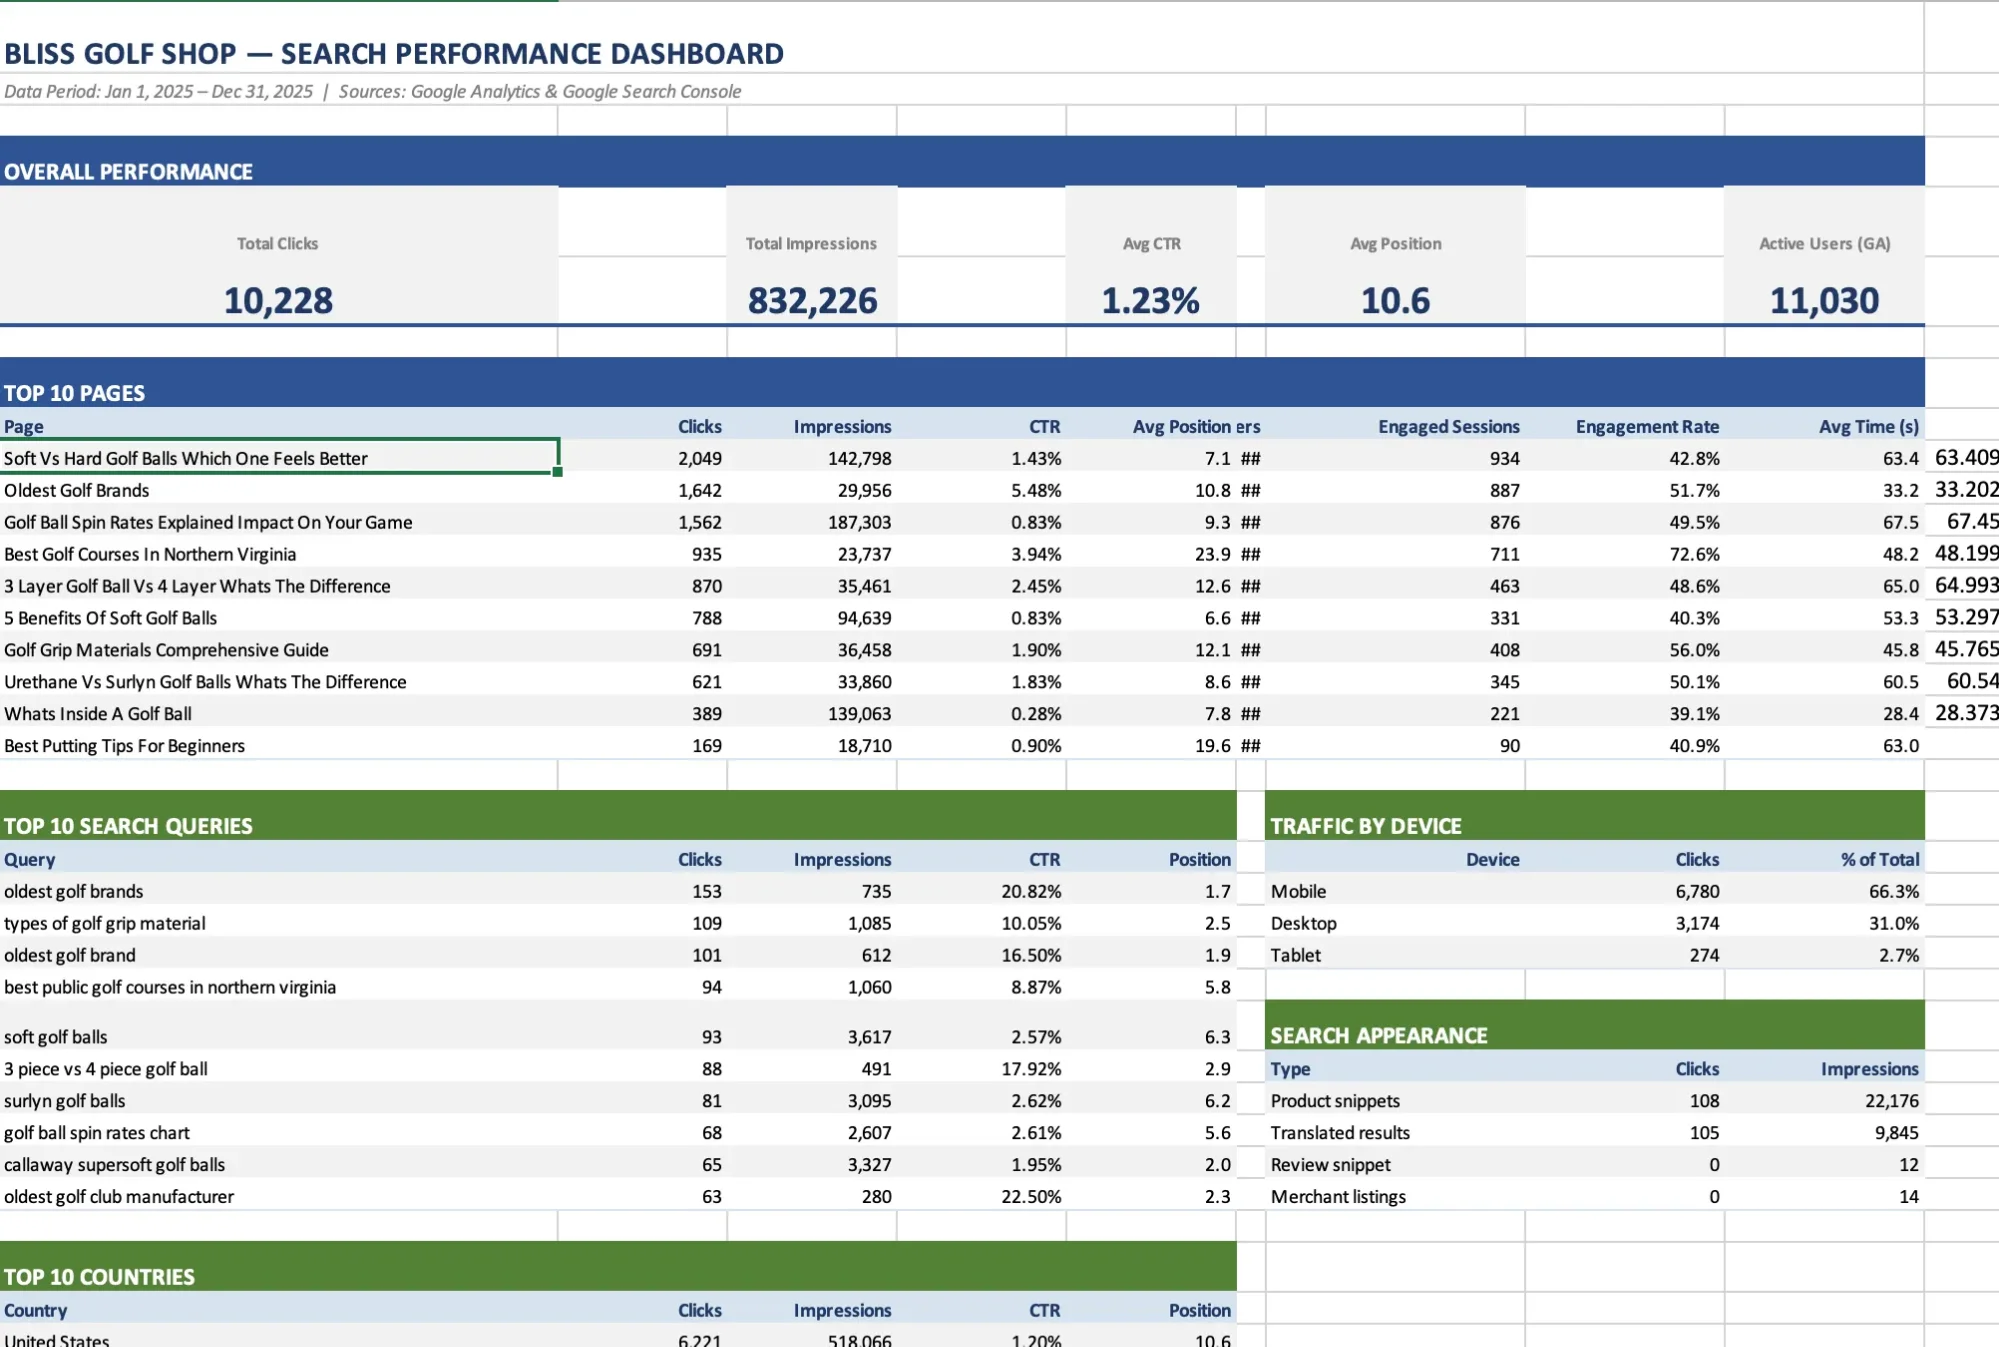
We tested Claude with 7 unlabeled CSV files containing SEO data. It produced this dashboard for us in under 10 minutes.
What You Need Before Starting
- Microsoft Excel
- Any paid Claude subscription
- 3–10 CSV files with raw data
Step 1: Install Claude and Gather Your CSVs
Install Claude in Excel from the Microsoft Marketplace.
Then, collect 5–10 CSV files with data.
You can test this workflow with sales data, expense reports, or any other information you regularly report on each month.
Tip: Use data sources from the same time period for the cleanest results.
Step 2: Import and Organize the Data
Open a fresh Excel workbook. Import each CSV as its own tab by going to File, then Import, and CSV. Select “comma” as the delimiter.
Next, click the Claude logo in the top-right corner and start with a prompt like this:
I imported [data type] data from [source 1] and [source 2] from my website. Can you rename all the tabs and reformat all the data in the sheet so it is easier to read?
We saw better results when asking Claude whether he could complete the task first. This encourages it to review the data, assess what it can do, and create a plan. You can also directly ask Claude to make a plan.
Tip: Ask Claude to color-code tabs by data source and convert the data in each tab into tables.
Step 3: Create the Master Report
Prompting Claude to build the main dashboard is a key step. We tested several approaches and got the best output by first asking Claude to review all the data and suggest how to connect it.
Use this prompt:
What do you recommend doing to connect all this data into a quick master report sheet?
Claude separated each data source into tables and created formulas to pull everything into one report.
Step 4: Add Charts and Turn It Into a Template
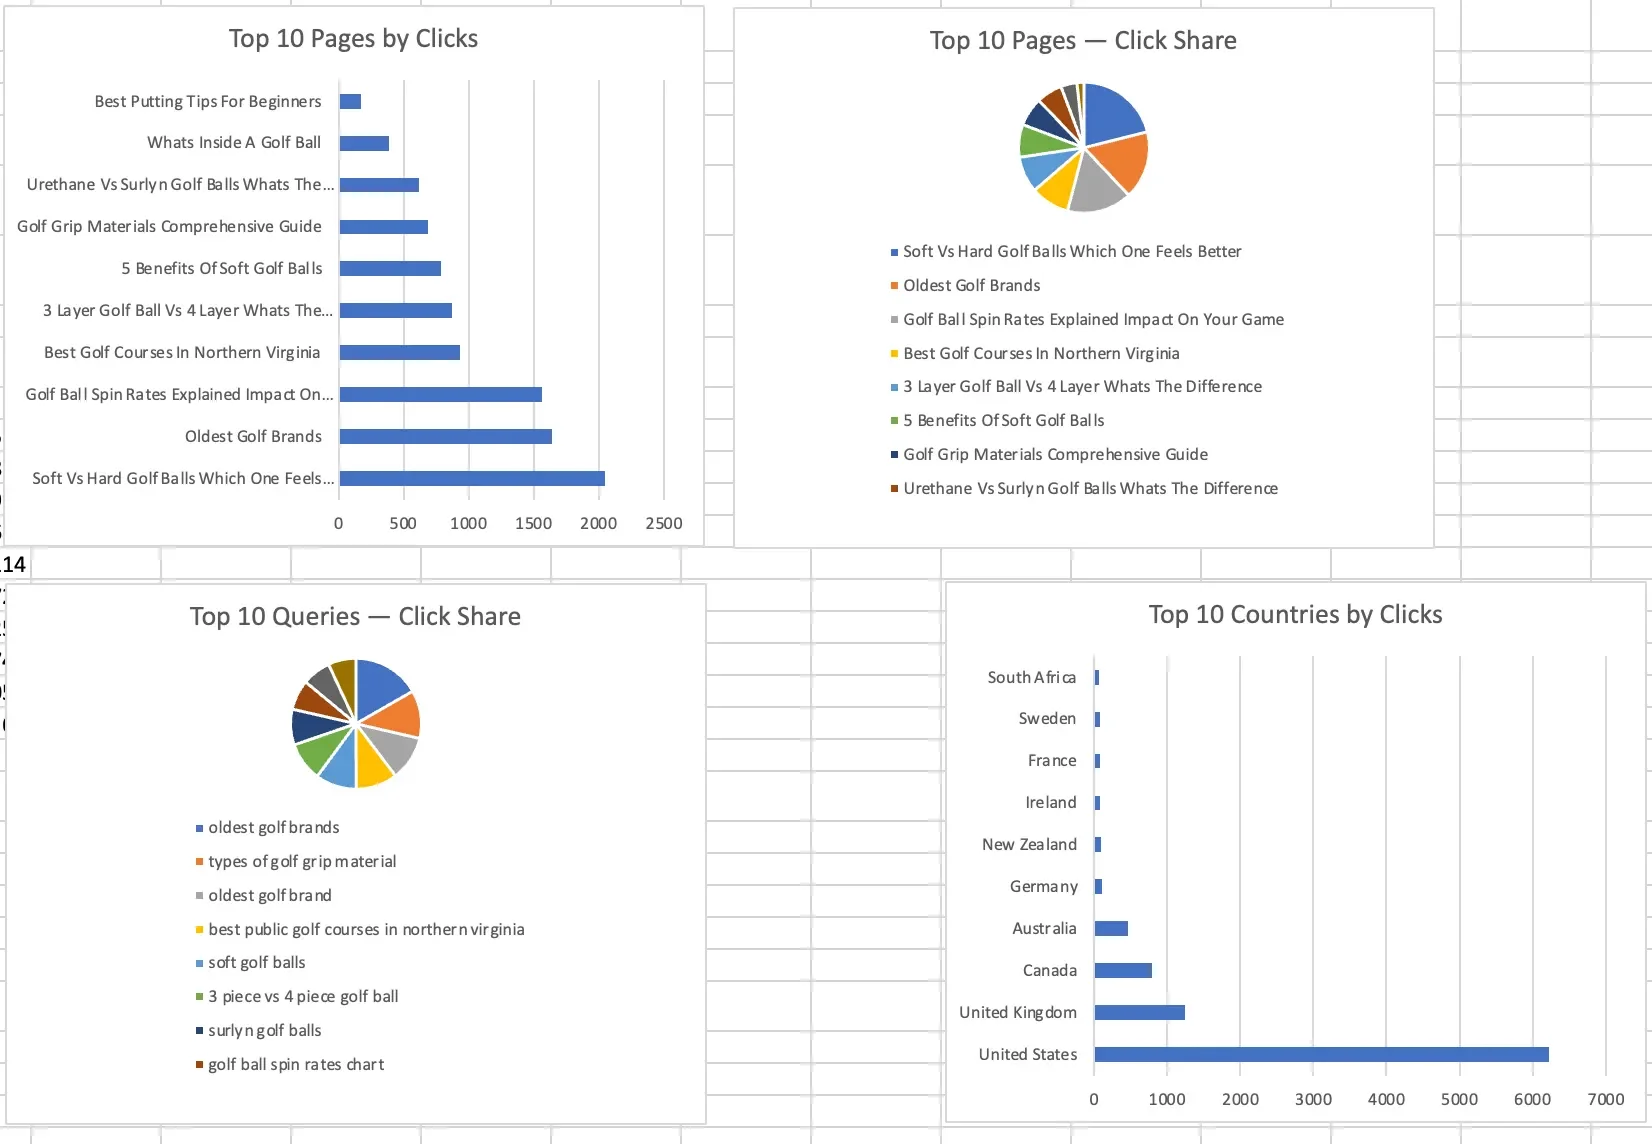
Claude can also create charts from your data. We asked it to visualize each section of the dashboard.
Once you have a report you like, ask Claude to convert it into a reusable template.
Use this prompt:
Adjust the Dashboard formulas so this works as a template I can use each month by importing the data into each tab. Create a README tab explaining how to use the template.
Next Steps
You can use Claude for Chrome to log in to your CRM and export the source data for you.
You can also make this a recurring workflow at the end of each month so you can track trends over time.
Emily Newton
Emily Newton is an experienced Editor-in-Chief who has spent the last decade sharing her insights on science and technology advances through platforms like IoT for All and DZone. She is deeply interested in showcasing how connected technologies and smart ecosystems transform modern businesses. When she isn’t writing, Emily enjoys walking local trails, playing video games, or curling up with a good book.