AI Tutorial
Create a Strategy Deck People Will Read from One Messy Dataset with Claude Design
Learn how to turn one messy dataset into a polished strategy deck using Claude Design, with charts, rankings, insights, and clear recommendations.
Share
In this guide, you will learn how to use Claude Design to turn raw data into a practical strategy deck with real insights, not generic AI filler. Claude Design helps identify what is working and turns those findings into clear recommendations your team can use.
Who Is It For?
- This guide is for marketers and creators who need to turn campaign or content data into a useful presentation.
- It is also useful for founders and operators working with messy exports from Shopify, Facebook ads, Stripe, YouTube, or a CRM.
- Consultants and analysts can use this workflow to create a quick first draft of a deck before refining it for a client or team.
What You Need
- You need a paid Claude account.
- You also need a CSV or spreadsheet with the data you want to analyze and turn into a strategy deck.
Step 1: Begin with One Data Source
Do not upload every file you have into Claude Design. Doing that slows the project down, uses more of your allowance, and often results in an overloaded deck.
Start with one clean spreadsheet or CSV. This workflow can be used for YouTube channel data, Facebook ad reports, Shopify exports, sales data, customer research, or any messy report you need to explain clearly.
If you have supporting files, include only the ones that help make the data easier to understand. For a YouTube analysis, that could mean thumbnails, titles, and descriptions connected to each video.
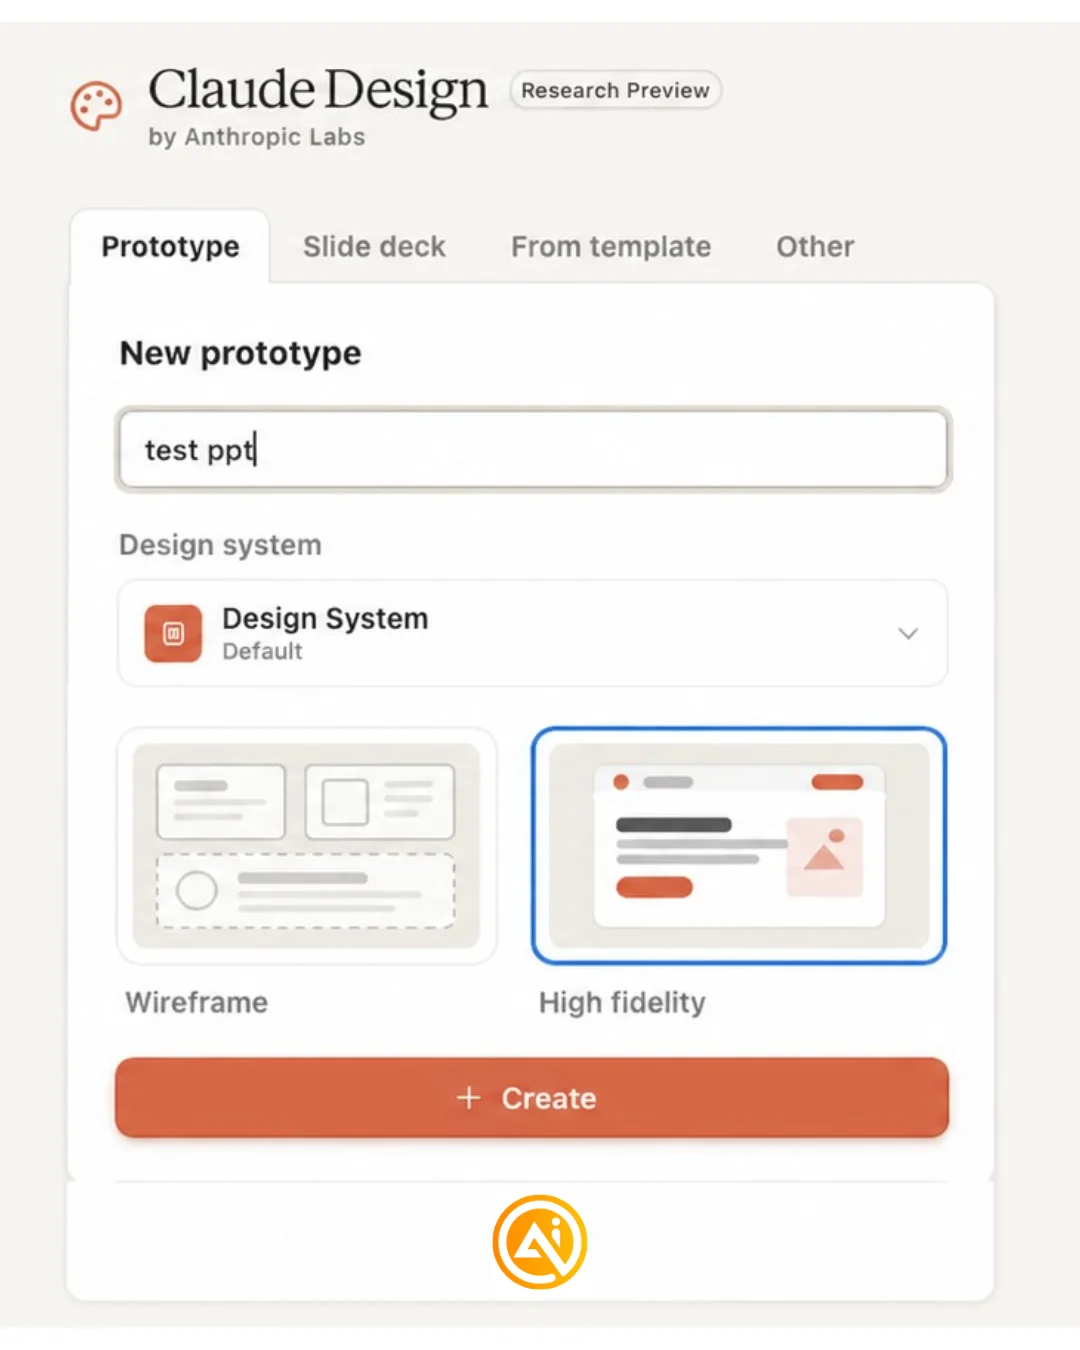
Step 2: Set Up a Slide Deck in Claude Design
Open claude.ai/design, choose Slide deck, and keep the setup simple.
For this workflow, skip the design system unless your team already has one uploaded. Turn on speaker notes so Claude can keep the slides cleaner instead of placing every detail on the slide itself.
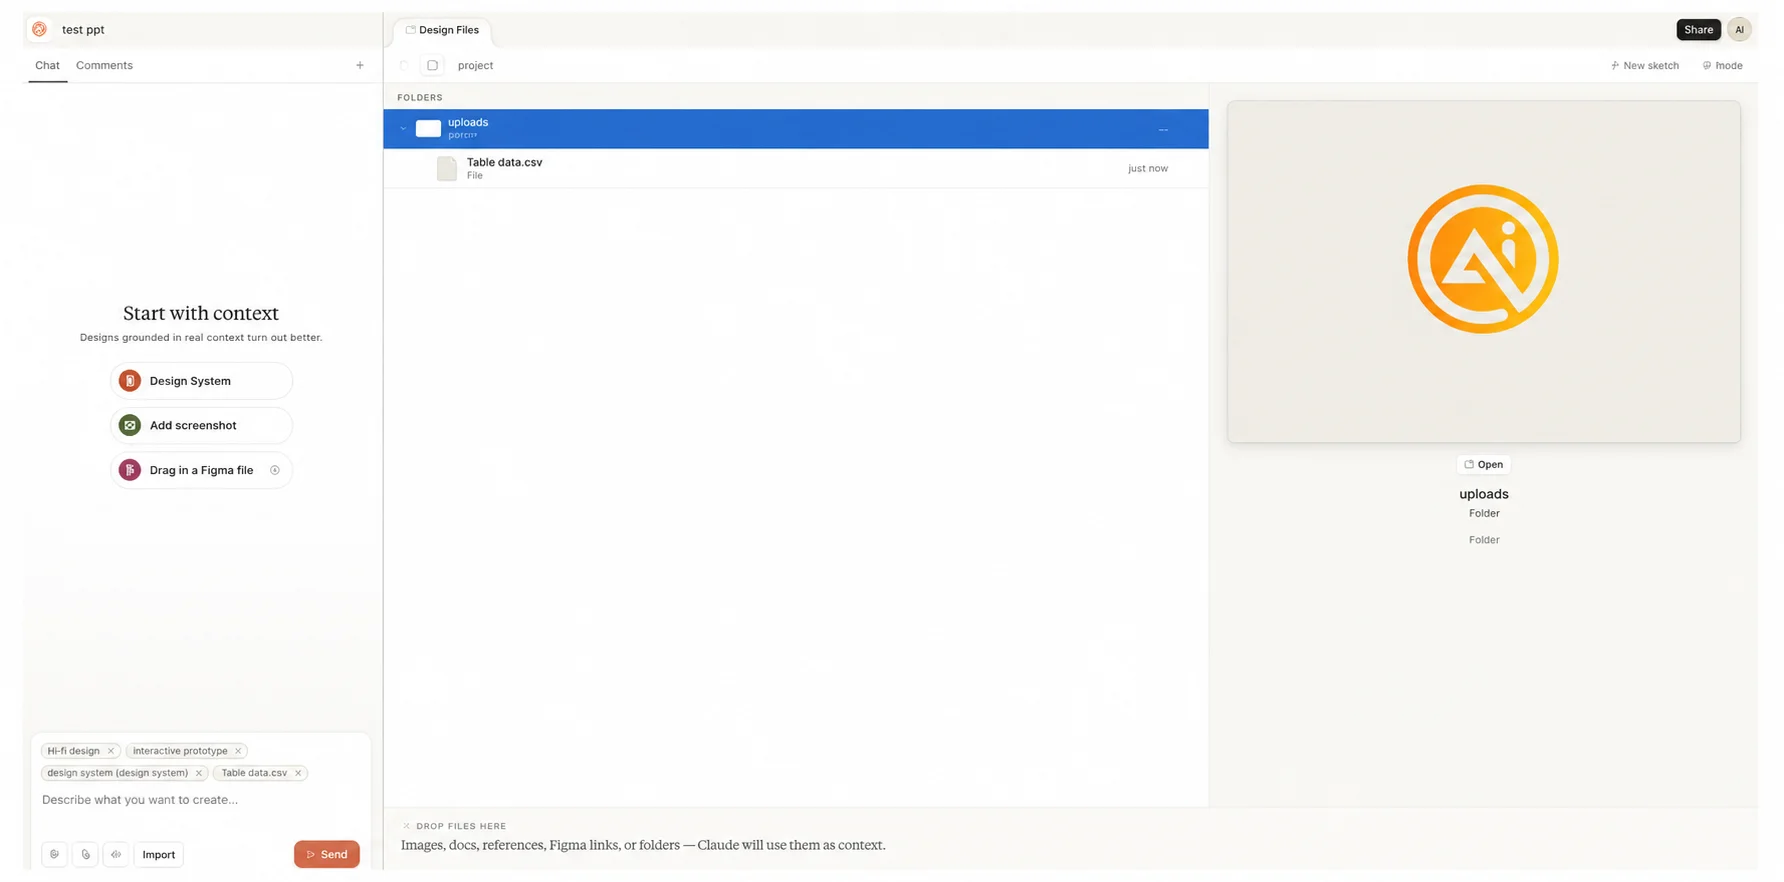
Step 3: Upload the Dataset
Once the project opens, upload your spreadsheet and any relevant supporting assets.
If you are adding images or creative files, make sure the filenames or spreadsheet fields clearly show how they connect. Claude needs a way to match each asset with the correct row.
Step 4: Ask for Strategy, Not Just Analysis
The prompt is the key part. Do not ask Claude to simply analyze the data. Push it toward strategic thinking, clear decisions, and useful takeaways.
Use this prompt:
Turn these files into a strategy deck on performance. Analyze the results by item and extract best practices from the data and supporting assets. Use charts, rankings, and concrete recommendations. Match any images or creative files to the CSV using the filename or matching field. Keep it crisp and presentation-ready.
If you know which categories you want Claude to evaluate, add them to the prompt. In the YouTube example, the prompt asked Claude to review thumbnails, titles, descriptions, and subject matter. Replace those with the categories that matter for your dataset.
Step 5: Review the First Version
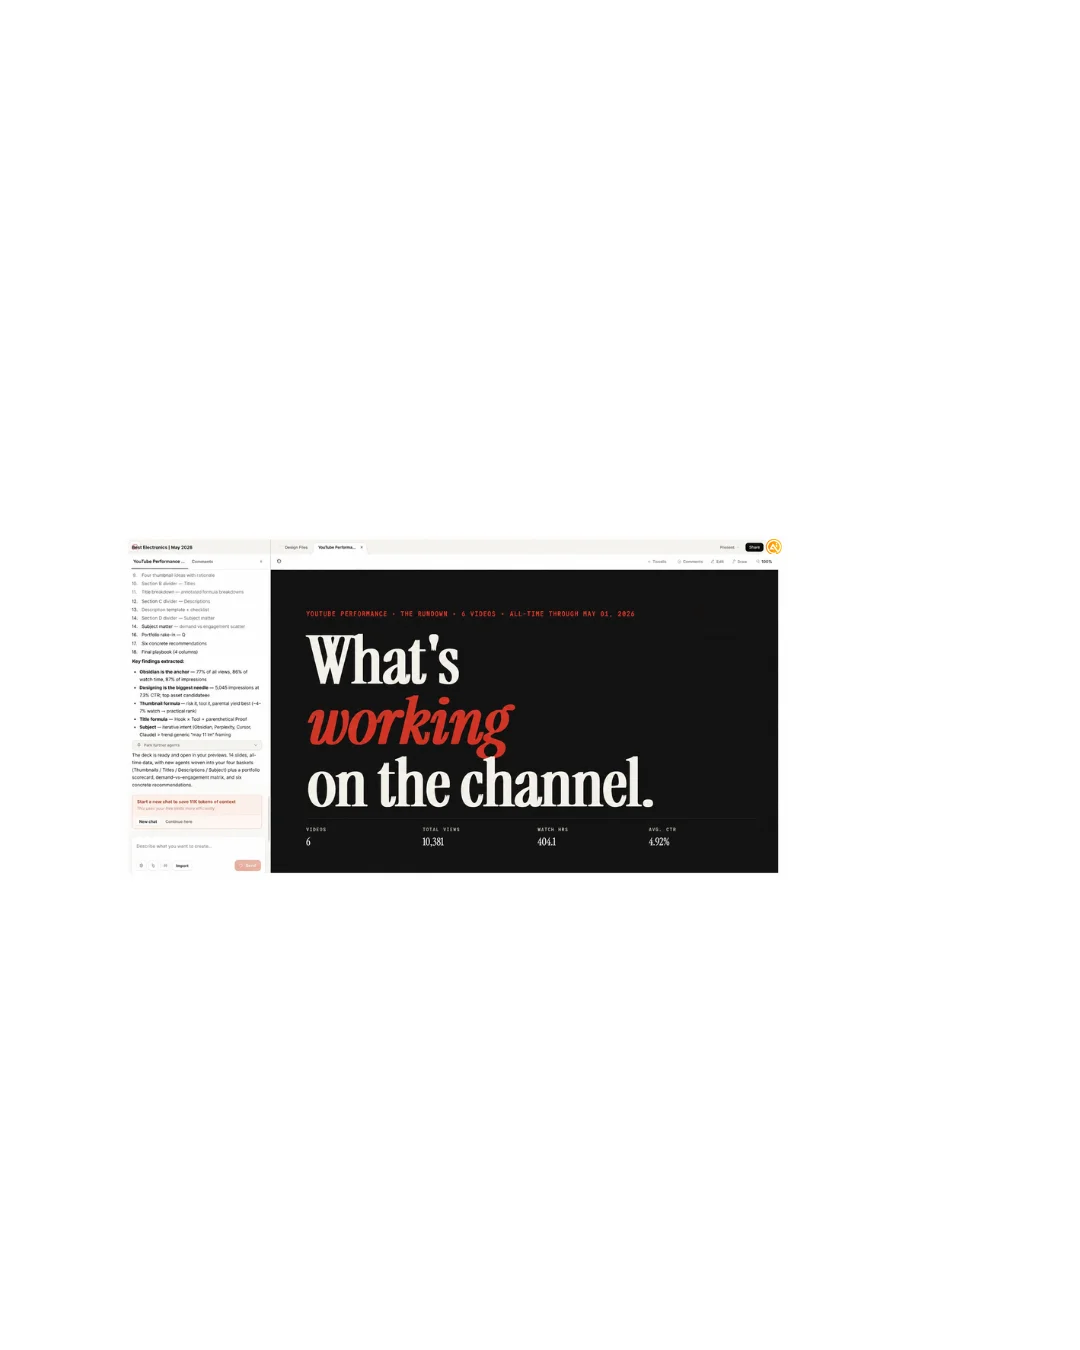
Claude Design can take 10–15 minutes to create the deck. The first time you use this workflow, watch how it works through the data instead of sending the prompt and leaving.
Check whether the deck is doing more than repeating numbers. A useful deck should show what is working, explain why it matters, and turn patterns into next steps.
Use this prompt if you need to replace the dataset:
Here is an updated CSV with the correct date range. Everything else should be the same. Rebuild the deck using this file instead.
Step 6: Fix the Specific Issue
Do not restart the whole project if the first version is close. Fix the exact problem instead.
If the deck focuses on the wrong metrics, ask Claude to rebuild it around the numbers that best explain performance and reduce the focus on vanity metrics.
Use this prompt:
Rebuild this deck around the metrics that best explain performance. De-emphasize vanity metrics and explain why the chosen KPIs matter.
If the slides feel too crowded, ask for cleaner hierarchy, fewer words per slide, and stronger contrast.
Use this prompt:
Tighten the visual style. Make this feel like a polished strategy presentation, not a generic AI deck. Use cleaner hierarchy, fewer words per slide, and stronger contrast.
If the charts are not strong enough, ask for comparisons between top and bottom performers, pattern clusters, and visuals that connect choices to results.
Use this prompt:
Add more useful charts. Compare top and bottom performers, show pattern clusters, and visualize which choices correlate with better performance.
In the test run, Claude Design produced a strong deck because the starting prompt asked for best practices and recommendations. It used the thumbnails, compared winners with weaker performers, and created slides that felt closer to do-this-not-that guidance than a basic analytics recap.
Going Further
Once you have a deck structure that works, duplicate the project and add more data later. You could add another month of campaign data, a second channel, a different product line, or a new batch of sales exports. Smaller, focused decks usually work better than one large project with every source included at once.
If your team or company has a design system uploaded in Claude Design, you can use it here to automatically format the deck with your logos, fonts, and colors.
Editorial Staff
The Editorial Staff at AIChief is a team of Professional Content writers with extensive experience in the field of AI and Marketing. AIChief was Founded in 2025, AIChief has quickly grown to become the largest free AI resource hub in the industry. Stay connected with them on Facebook, Instagram and X for the latest updates.