AI Tutorial
Manage Your Business Finances Using Claude
Learn how to turn scattered financial documents into a clean, organized dashboard using Claude in just a few simple steps.
Share
This guide shows you how to bring scattered financial documents together into a clear and efficient dashboard.
Who Will Benefit
- Small business owners are frustrated with messy spreadsheets and files
- Solo founders and freelancers needing a simple financial overview without hiring an accountant
- Small teams without dedicated finance or accounting staff
- Managers who need to present KPIs and financial data in a clean, professional format to stakeholders or clients
STEP 1: Set Up Claude
Begin by accessing Claude (free or paid version).
Log into your account. While the free plan works, keep in mind:
- It limits the number of iterations
- Advanced tools and integrations require an upgrade
Within the chat interface, select a strong model for the task. Sonnet 4.5 is a good choice for speed and performance.
Open model settings and:
- Enable extended thinking if available
- Turn on web search if you want Claude to verify assumptions
For occasional use, the free plan is fine. For consistent financial tracking, upgrading is recommended due to better tool access and flexibility.
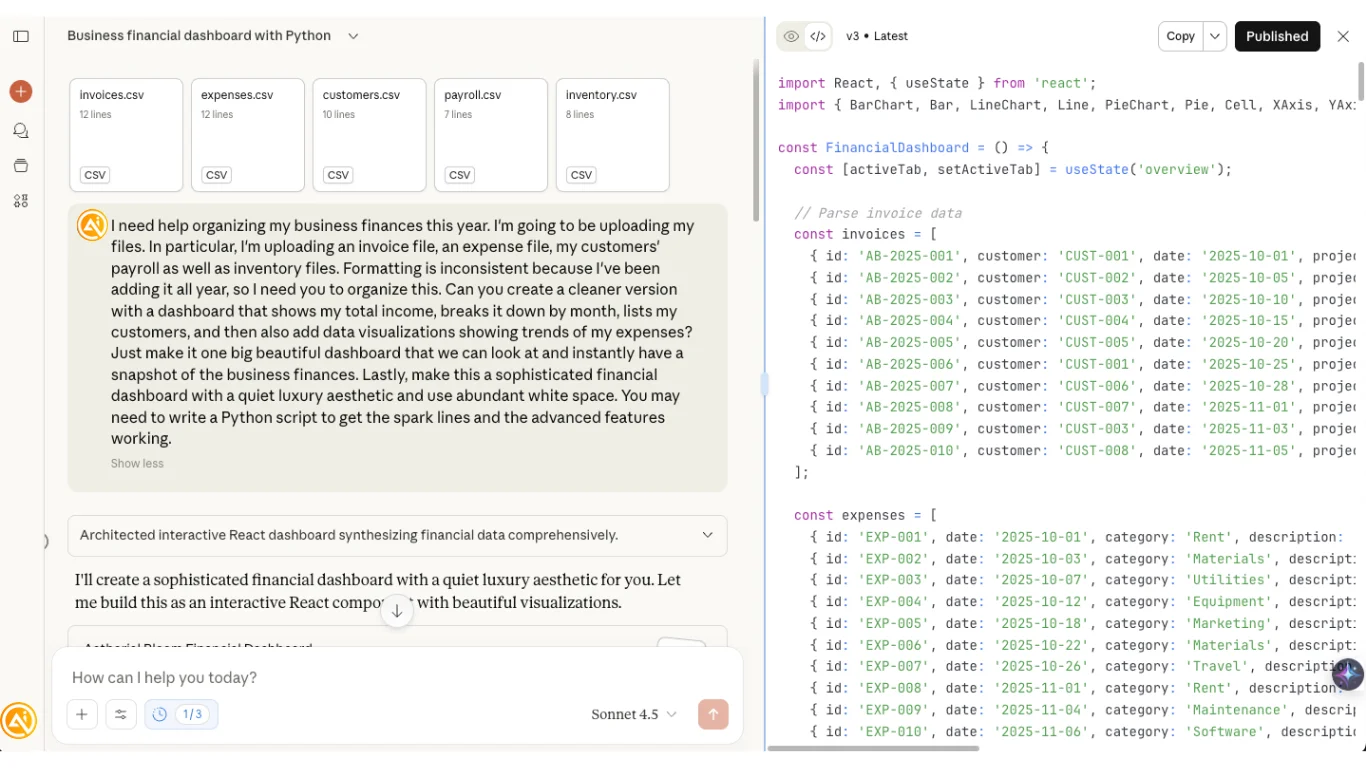
STEP 2: Upload Financial Data and Give Instructions
Upload your financial files, such as revenue reports, invoices, expense records, and inventory data.
Next, provide clear instructions in the chat. Your prompt should include:
- Your goal
- The files you’ve uploaded
- How the information should be structured
- The desired layout and design of the dashboard
Most financial dashboards feel outdated. Being specific about design ensures the result is something stakeholders will actually engage with.
Submit your prompt to begin.
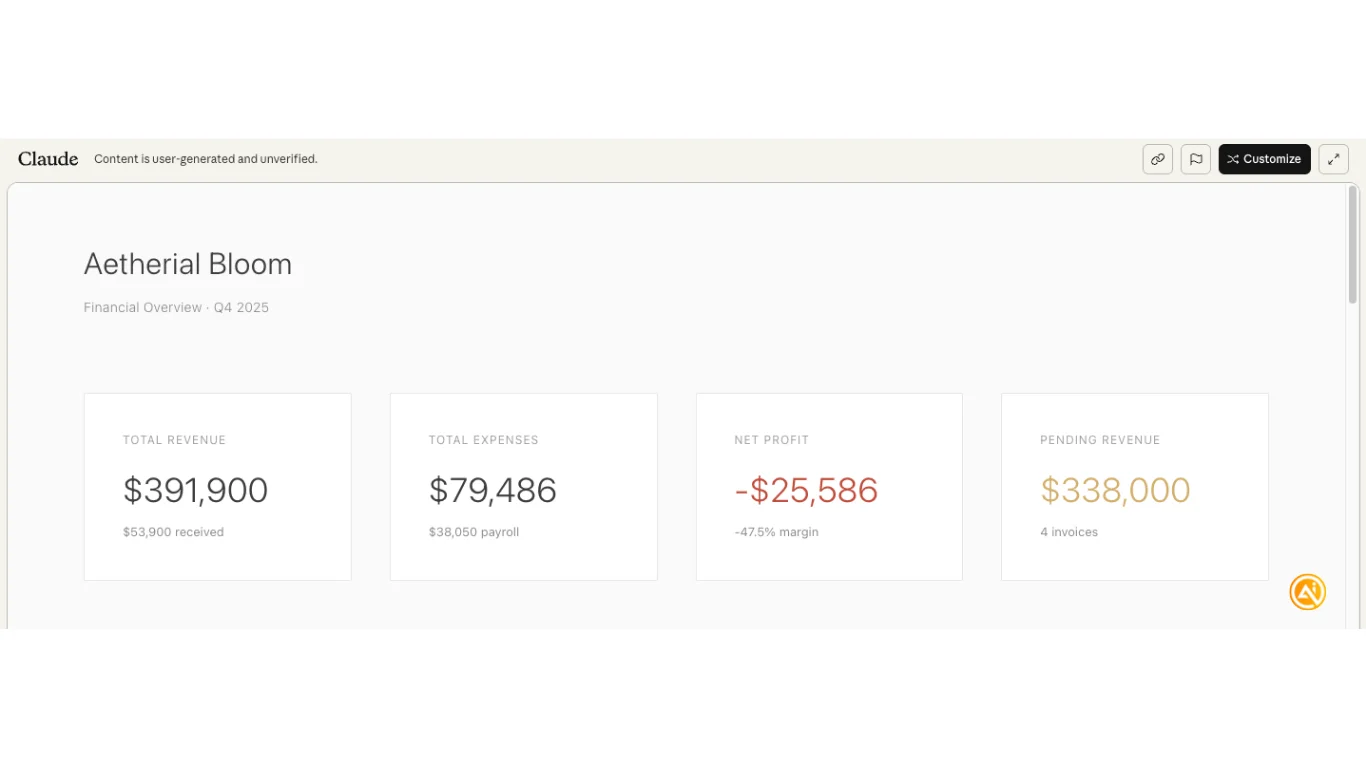
STEP 3: Review and Refine the Dashboard
You’ll see a preview of the dashboard generated by Claude.
It highlights key figures such as total revenue, expenses, and net profit.
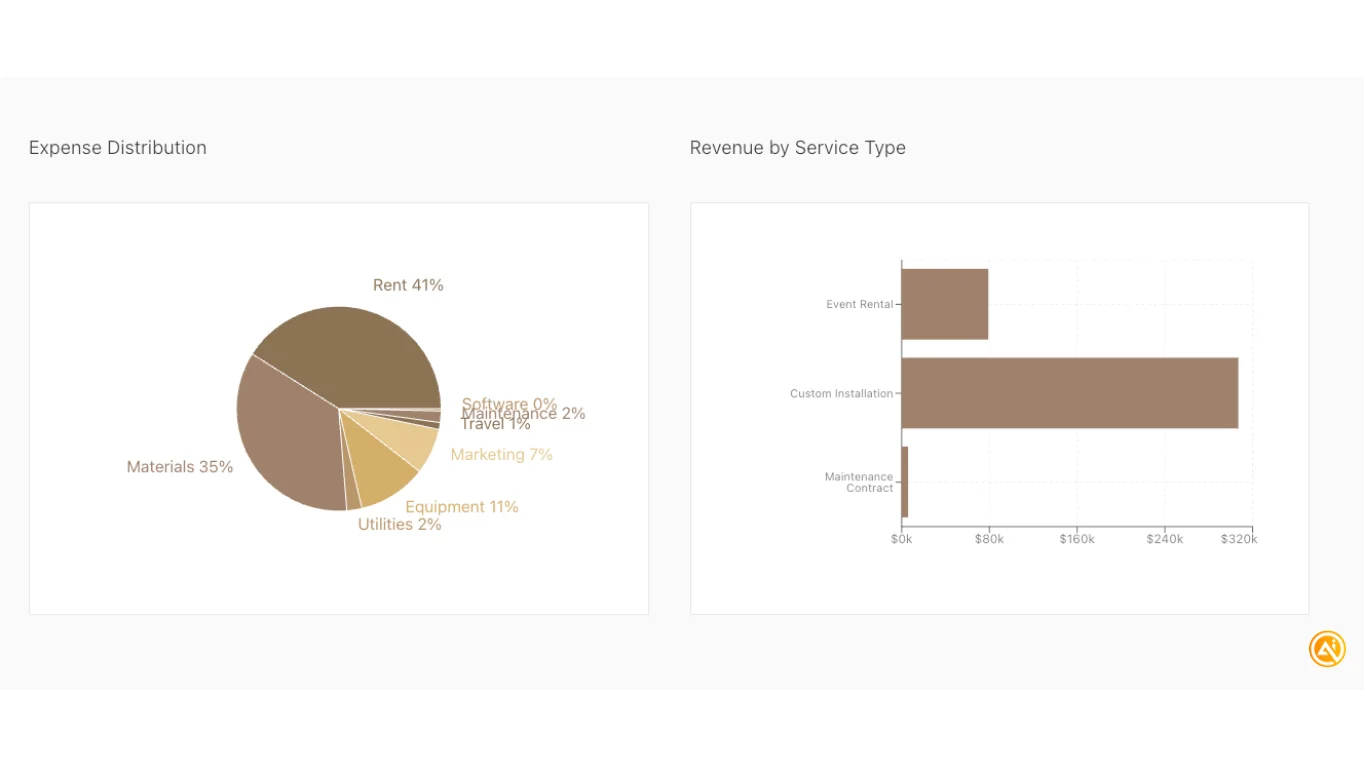
It may also include visual elements like pie charts and bar graphs for better clarity.
STEP 4: Customize and Compare Data
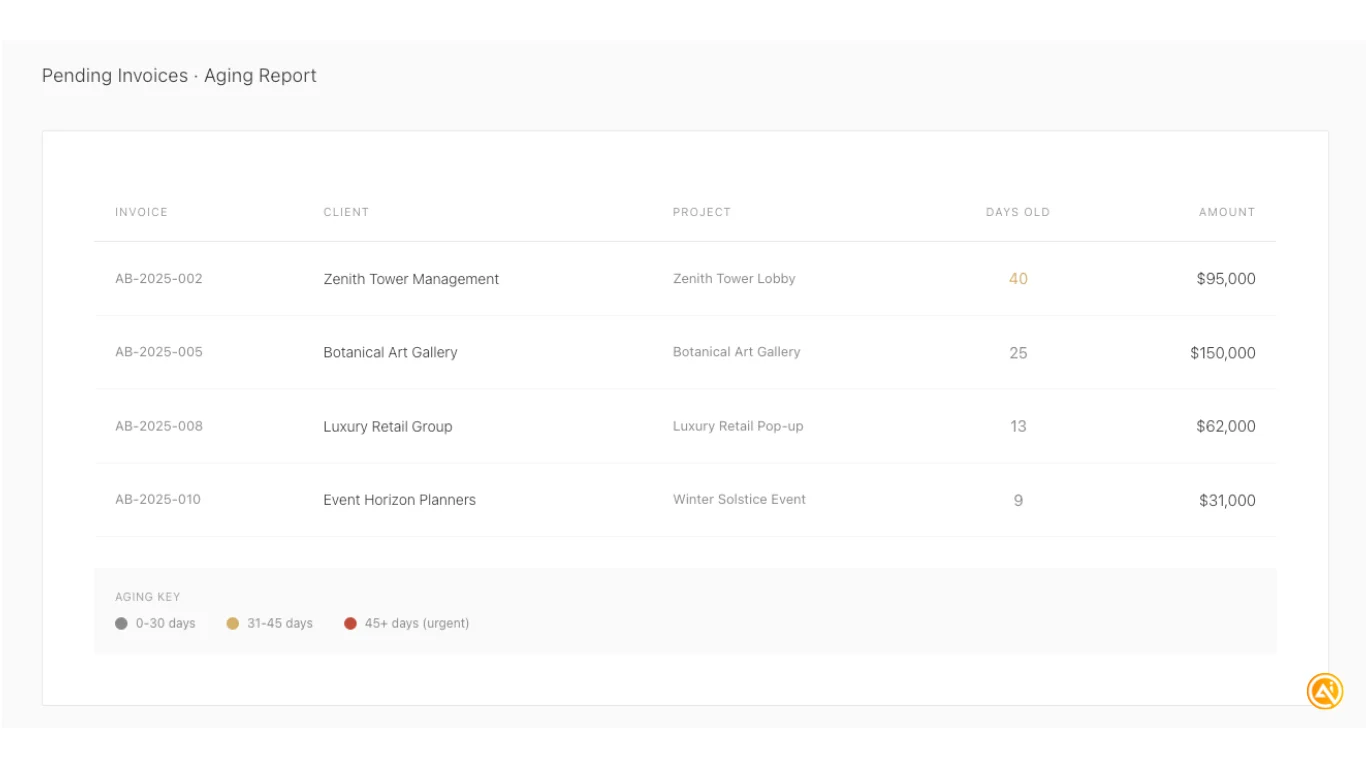
Use simple prompts to enhance the dashboard, for example:
“Add a column showing how many days each invoice has been outstanding so I can track overdue payments.”
This helps identify where follow-ups are needed.
Share Your Dashboard
Once finalized:
- Click publish
- Copy and share the link with stakeholders
Pro Tip: This approach works especially well for teams without dedicated finance personnel. It provides clear visibility into performance, highlights losses, and helps identify areas for improvement or cost reduction.
Emily Newton
Emily Newton is an experienced Editor-in-Chief who has spent the last decade sharing her insights on science and technology advances through platforms like IoT for All and DZone. She is deeply interested in showcasing how connected technologies and smart ecosystems transform modern businesses. When she isn’t writing, Emily enjoys walking local trails, playing video games, or curling up with a good book.