Tableau Alternatives

Tableau
Paid Plans - from $15
AI Data Management
Tableau is a powerful data visualization and analytics tool designed for professionals seeking to harness the potential of their data. It transforms complex datasets into clear, interactive visuals. Users can easily identify trends and patterns, enabling informed decision-making. Tableau?s intuitive interface simplifies data analysis, even for those without extensive technical skills. The platform supports collaboration, allowing teams to share insights seamlessly.One of Tableau's standout features is its ability to handle large volumes of data while maintaining high accuracy and security. Users can trust that their data is governed effectively, ensuring relevance and compliance with industry standards. Ready-to-use narratives further enhance the storytelling aspect of data, making it accessible to non-technical stakeholders.With its web-based interface, Tableau is flexible and can be accessed from anywhere, making it ideal for remote work environments. Although Tableau is a leading choice in data visualization, users may explore alternatives that can offer different features or pricing structures. Considering options like Power BI or Qlik can help find a tool that best fits specific needs. Exploring these alternatives can lead to discovering the best solution for your data visualization requirements.
List of Tableau Alternatives

Knowbase AI
Free
AI Data Management
Knowbase AI is an innovative knowledge management platform designed to help users efficiently store and organize various file types. It features a conversational interface that makes interaction intuitive and user-friendly. This tool is particularly beneficial for researchers, business professionals, students, and content creators who need to manage extensive information easily.
Key features include multi-format support, advanced transcription services for audio and video, and a centralized library for easy access to materials. The platform also supports collaborative sharing, making it easy for teams to work together. With its multi-language capabilities, Knowbase AI enhances accessibility for a diverse user base.
What sets Knowbase AI apart is its ability to streamline knowledge retrieval through AI-powered search, ensuring users can find information quickly. While it offers a free plan with limited storage and queries, exploring alternatives might uncover tools that better fit your specific requirements. Consider looking into other options to discover the knowledge management solution that aligns perfectly with your needs and enhances your productivity.

Visspot
Free
AI Data Management
Visspot is an innovative AI-driven knowledge management tool designed to help users efficiently organize and retrieve various media types, including images, PDFs, links, and videos. This platform is ideal for business professionals, educators, researchers, and content creators who need a streamlined way to manage information without any coding skills. Visspot transforms multimedia into a smart knowledge repository, enhancing productivity and accessibility.
Key features include a user-friendly interface, support for multiple media formats, and advanced information retrieval capabilities. Users can easily create a customizable AI knowledge base that adapts to their specific needs. Visspot stands out for its no-code approach, making it accessible to everyone, regardless of technical expertise.
The tool operates on a subscription-based pricing model, offering a free trial for new users to explore its features. Pricing plans cater to different user requirements, ensuring flexibility. While Visspot is a robust solution for knowledge management, exploring alternatives may lead you to discover tools that better fit your unique workflow and preferences.

Invoicedataextraction
Free
AI Data Management
InvoiceDataExtraction.com is a cutting-edge AI tool designed to streamline the process of extracting data from invoices. This platform transforms various document types, including PDFs and images, into organized Excel spreadsheets with remarkable accuracy, exceeding 98%. It caters to businesses of all sizes, making it an ideal choice for accountants, small business owners, and finance teams.
What sets InvoiceDataExtraction.com apart is its ability to accept natural language instructions, eliminating the need for complicated templates. Users can easily guide the extraction process, saving time and minimizing manual errors. The platform also offers a user-friendly interface, ensuring that even those with limited technical skills can navigate it effortlessly.
InvoiceDataExtraction.com provides a free plan that allows users to process up to 50 pages monthly, making it perfect for small-scale operations. Paid plans start at just $10 per month, offering enhanced features for those with greater needs. If you are considering alternatives, exploring other tools may reveal options that better align with your specific requirements and budget. Take the time to find the best solution for your data extraction needs.

Ossinsight Io
Free
AI Data Management
OSS Insight is a powerful analytics tool designed to provide in-depth insights into open-source software development by analyzing GitHub events. With the ability to process over 5 billion GitHub events, it delivers real-time data on repositories, contributors, and programming languages. This makes it an excellent resource for open-source developers, data analysts, project managers, and researchers who want to understand project activity and trends.
What sets OSS Insight apart is its user-friendly interface and advanced data visualization capabilities. Key features include real-time data processing, comprehensive repository analysis, and natural language query support. These features empower users to make informed decisions based on accurate data. OSS Insight is completely free, offering all its features without any cost, making it accessible to everyone interested in open-source analytics.
While OSS Insight excels in GitHub data analysis, it may not cover other platforms. If you are exploring tools for open-source analytics, considering alternatives could help you find solutions that better meet your specific requirements and enhance your analytical capabilities.

Evolution AI
Paid Plan - Custom
AI Data Management
Evolution AI is a cutting-edge artificial intelligence platform focused on intelligent document processing. This tool automates data extraction, text analysis, and workflow management, converting unstructured documents into structured, actionable insights. It is especially useful for sectors like finance, insurance, and legal services, where operational efficiency and accuracy are paramount.
One of Evolution AI's standout features is its advanced optical character recognition, which ensures high-quality data extraction from complex documents. The platform also offers machine learning-based text analysis, enhancing the accuracy of insights derived from documents. Its user-friendly interface makes it accessible for professionals at all levels. With a pay-per-page pricing model, businesses only pay for what they use, making it a flexible and cost-effective solution.
While Evolution AI is powerful, users may want to consider alternatives that provide different functionalities or pricing structures. Exploring other options can help you discover tools that better align with your specific needs and enhance your document processing capabilities.

Briink
Free
AI Data Management
Briink is an innovative AI-driven platform that streamlines Environmental, Social, and Governance workflows. It specializes in automating the extraction, analysis, and verification of ESG data from various unstructured sources, such as documents and websites. This tool is perfect for organizations aiming to enhance their sustainability reporting processes with improved efficiency and accuracy.
Briink is tailored for ESG professionals, sustainability analysts, compliance officers, and procurement teams. Its user-friendly interface ensures that both novices and experts can navigate the platform with ease. Key features include AI-powered questionnaire automation, comprehensive data collection, and regulatory gap analysis, making it a standout choice in the ESG landscape.
The platform operates on a freemium model, allowing users to access basic features at no cost while offering advanced functionalities through paid plans. While Briink excels in automating ESG data tasks, it may be beneficial to explore alternatives that could better align with specific needs or budget considerations. Consider investigating other ESG automation tools to discover the best fit for your organization’s sustainability goals.

Findly AI
Free
AI Data Management
Findly AI is an innovative AI-powered data assistant designed to simplify data access and analysis for users of all skill levels. This tool allows individuals to query data using natural language, eliminating the need for coding expertise. It integrates effortlessly with popular platforms like Google Analytics and Slack, providing immediate insights and visualizations that enhance decision-making.
What sets Findly AI apart is its advanced natural language processing capabilities, which enable users to obtain quick data insights without technical barriers. The platform features customizable reports and secure data handling, making it suitable for business analysts, marketing teams, and product managers. Its user-friendly interface ensures that both small businesses and larger organizations can benefit from its functionalities.
While Findly AI is a powerful tool for data analysis, exploring alternatives may reveal options that better suit your specific needs. Other tools might offer different features or pricing plans that could enhance your data analysis experience. Consider evaluating various alternatives to find the best solution for your analytical requirements.

Kudra AI
Free
AI Data Management
Kudra AI is an innovative platform that specializes in automating data extraction from various document types. Utilizing advanced technologies like Optical Character Recognition and Named Entity Recognition, it streamlines workflows across sectors such as finance, legal, and human resources. This tool is perfect for professionals looking to minimize manual data entry and enhance accuracy.
One of Kudra AI's standout features is its ability to support multiple document formats, making it versatile for different industries. Users can also benefit from customizable AI models tailored to specific document types, ensuring optimal performance. The platform includes pre-built templates and workflow automation, which significantly boosts efficiency.
Kudra AI offers a free plan that allows users to upload 100 pages monthly, making it accessible for small-scale users. However, its paid plans start at $299 per month, which may not suit everyone’s budget. If you are exploring options for automated document processing, considering alternatives to Kudra AI might lead you to a solution that better fits your needs and financial constraints.

Send AI
Paid Plan - Custom
AI Data Management
Send AI is an innovative document processing platform designed to enhance business efficiency by automating document workflows. This tool is perfect for enterprises, small to medium-sized businesses, non-profits, healthcare providers, and financial institutions that handle large volumes of documents. By utilizing advanced machine learning and optical character recognition technologies, Send AI streamlines tasks like parsing, classifying, and extracting data.
One of its key features is automated document parsing, which significantly reduces manual data entry errors. Users can enjoy smart data extraction and seamless data export, making it easier to manage information across various formats. The platform also offers custom workflow configurations to meet specific business needs, ensuring adaptability.
While Send AI does not provide a free version, it offers tailored pricing plans based on user requirements. The absence of readily available pricing may be a drawback for some. If you are looking for efficient document automation, it might be worthwhile to explore alternatives to Send AI that could better fit your specific needs and budget.

Formx AI
Free
AI Data Management
FormX.ai is a powerful AI-driven platform designed to automate data extraction from various documents, transforming them into structured formats like JSON or CSV. This tool is ideal for small to medium enterprises, financial institutions, logistics companies, and healthcare providers seeking to enhance operational efficiency. By utilizing advanced OCR and AI technologies, FormX.ai streamlines processes such as receipt scanning and invoice processing, significantly reducing manual data entry errors.
Key features include pre-configured data extraction models, effortless API integration, and mobile scanning capabilities. Users benefit from a user-friendly web portal that supports customizable data extraction fields and multi-language options. The platform is particularly noted for its high accuracy and continuous model improvement, making it a reliable choice for businesses.
FormX.ai operates on a freemium model, allowing users to process a limited number of documents for free. For those considering document automation solutions, exploring alternatives to FormX.ai could lead to discovering tools that better align with your specific requirements and budget.

Klearstack
Paid Plan - Custom
AI Data Management
KlearStack is a powerful AI-driven platform designed for Intelligent Document Processing. It automates the extraction, classification, and validation of data from unstructured and semi-structured documents. This tool is ideal for businesses aiming to streamline their document workflows and improve operational efficiency. By utilizing advanced machine learning, computer vision, and natural language processing, KlearStack converts various document formats into actionable insights.
The platform boasts a user-friendly interface that simplifies the setup process, allowing users to quickly begin data extraction. Key features include template-free automation, self-learning AI models, and real-time validation. KlearStack excels in high-accuracy data extraction and supports multi-channel document ingestion. It integrates seamlessly with existing systems like ERP and accounting software, making it a great fit for enterprises, financial institutions, logistics companies, and healthcare providers.
While KlearStack does not offer a free version, its pricing is tailored to organizational needs. If you are considering document processing solutions, exploring alternatives to KlearStack may help you find a tool that better suits your specific requirements and budget.

Parsio IO
Free
AI Data Management
Parsio IO is an innovative AI-driven document parsing tool designed to simplify data extraction from various sources like emails and PDFs. This platform is perfect for businesses looking to automate their data workflows, transforming unstructured information into organized formats. Its primary goal is to enhance efficiency and accuracy in data handling.
The tool features a user-friendly interface that allows users to set up and start extracting data quickly. Key functionalities include real-time data extraction, multi-document support, and integration with popular business applications such as Google Sheets and Slack. These features make Parsio IO a versatile choice for small to medium-sized businesses, marketing agencies, and financial analysts.
While Parsio IO offers both free and paid plans, the free version is suitable for individual users or small projects. However, businesses may find the paid plans more beneficial for extensive data extraction needs. If you are exploring document parsing solutions, considering alternatives to Parsio IO could lead you to tools that align better with your specific requirements and budget.

Docextractor
Free
AI Data Management
DocExtractor is an advanced AI document processing tool designed to simplify data extraction from unstructured documents like PDFs and scanned images. This innovative platform automates the conversion of complex documents into structured, actionable data, making it ideal for businesses seeking efficiency and accuracy.
DocExtractor excels with its user-friendly interface, allowing users of all skill levels to navigate easily. Its powerful machine learning technology ensures high accuracy in data extraction, which is crucial for industries such as finance, logistics, and human resources. The tool supports multiple document formats and offers bulk processing capabilities, making it versatile for various business needs.
While DocExtractor does not have a free version, it provides a free trial for users to test its features without any commitment. Pricing starts at $36 per month, which may be a consideration for smaller businesses. If you are exploring options for document processing, looking into alternatives to DocExtractor could help you find a solution that aligns better with your specific requirements.

Pantio IO
Paid Plan - from $$99
AI Data Management
Pantio IO is an innovative AI-driven data analysis tool designed to simplify complex data tasks for businesses. It is ideal for data analysts, business executives, IT managers, and product managers who need accurate insights quickly. By automating data analysis, Pantio IO helps organizations make informed decisions without manual effort.
This tool operates continuously, learning in real-time to provide consistent results. Its advanced machine learning capabilities ensure that users receive actionable insights quickly. Key features include 24/7 operation, data visualization, and seamless cloud integration, making it user-friendly and efficient. The platform also emphasizes risk mitigation and scalability, catering to businesses of all sizes.
While Pantio IO operates on a subscription basis, offering various pricing plans to suit different organizational needs, it does not provide a free option. Some users may find the subscription cost a consideration, especially for smaller teams. If you are exploring data analysis tools, consider looking into alternatives that might better align with your budget and specific requirements.

AImaps App
Paid Plan - Custom
AI Data Management
AiMaps is an innovative cloud-based tool developed by IDS GeoRadar, aimed at improving the detection and analysis of underground utilities. This software harnesses the power of artificial intelligence to process Ground Penetrating Radar data, delivering clear and actionable insights. It is particularly beneficial for utility surveyors, construction managers, geotechnical engineers, and environmental consultants who require precise subsurface information for their projects.
One of AiMaps' standout features is its ability to enhance data clarity, which significantly boosts productivity and can reduce project costs by up to 70%. The platform's user-friendly interface makes it easy for professionals to navigate and utilize its advanced deep learning capabilities. Additionally, AiMaps integrates seamlessly with IQMaps, further enriching the analysis of GPR data.
While AiMaps operates on a subscription-based pricing model, it offers various plans to suit different user needs. If you are exploring options for underground utility detection, considering alternatives to AiMaps may lead you to a solution that aligns more closely with your project requirements.

Scale
Paid Plan - Custom
AI Data Management
Scale AI is a premier data annotation platform designed to prepare high-quality datasets for training artificial intelligence models. Established in 2016, it has quickly become a vital resource for AI developers, enterprises, government agencies, and research institutions. The tool excels in delivering precise data annotation services, making it indispensable for those needing reliable datasets.
With features like comprehensive data annotation, AI application development, and scalable solutions, Scale AI stands out in the competitive landscape. Its user-friendly interface ensures that clients can easily navigate the platform, while advanced AI technology enhances the quality of outputs. The tool is compatible across various platforms, making it accessible for diverse users.
Although Scale AI does not offer a free plan, its custom pricing is tailored to meet specific client needs. While it boasts numerous advantages, such as strong backing from major tech firms, exploring alternatives may reveal options that better suit your requirements. Consider looking into other tools to find the best fit for your data annotation and AI service needs.

Defog AI
Free
AI Data Management
Defog AI is a cutting-edge platform designed to empower businesses with data analysis through natural language queries. This tool is perfect for data analysts, business intelligence teams, and academic researchers who seek to derive insights from complex datasets without needing coding skills. Defog AI transforms intricate data into actionable insights, making it accessible for users at all levels of expertise.
One of its key features is real-time data processing, which allows users to obtain immediate results. The platform also offers interactive visualizations, enhancing the user experience and facilitating better decision-making. Its advanced NLP models ensure high accuracy, making data interpretation straightforward and reliable. Additionally, Defog AI supports integration with various data sources, including SQL databases and Google Sheets.
While Defog AI provides a robust solution for data analysis, users may want to explore alternatives that cater to different data environments or offer unique features. Investigating other options can help you find the tool that best aligns with your specific requirements and enhances your data analysis capabilities.

Bemi IO
Free
AI Data Management
Bemi IO is an innovative open-source tool designed to simplify data change tracking for PostgreSQL databases. It is ideal for database administrators, software engineers, compliance officers, and DevOps teams who need reliable audit trails without the complexity of traditional systems. Bemi IO operates quietly in the background, automatically tracking data changes and providing contextualized audit trails that enhance observability.
One of its standout features is time travel querying, allowing users to retrieve historical data effortlessly. The platform is user-friendly, making it accessible for both technical and non-technical users. Bemi IO also emphasizes security and transparency, ensuring full data ownership for its users. With a pricing model starting at $19 per month, it offers a 14-day free trial for those who want to explore its capabilities.
While Bemi IO excels in PostgreSQL integration, users may find it beneficial to explore alternatives that support other database systems or offer different functionalities. Consider looking into other options to discover what best meets your specific needs.

Chatviz IO
Free
AI Data Management
Chatviz IO is an innovative AI-driven data visualization tool that utilizes ChatGPT technology to simplify data interpretation and presentation. It is ideal for data analysts, developers, business intelligence teams, and researchers who need to transform complex datasets into clear visuals. With features like SQL translation and automatic chart generation, Chatviz IO streamlines the visualization process, saving users valuable time.
The platform boasts a user-friendly interface that makes it accessible for individuals with varying technical skills. Key features include easy integration with existing systems, secure operations, and a web-based platform that allows for flexibility. Users appreciate the free access to core functionalities, making it a cost-effective choice for organizations aiming to enhance their data capabilities.
What sets Chatviz IO apart is its seamless incorporation of AI technology, which enhances the accuracy and efficiency of data visualizations. While it excels in many areas, some users may seek more advanced customization options. If you are exploring your choices, consider looking into alternatives to Chatviz IO that might better suit your specific requirements.

Vizgpt AI
Free
AI Data Management
DataViz Pro is a cutting-edge AI-powered data visualization tool designed to transform complex datasets into engaging and informative visuals. It caters to a wide range of users, including data scientists, business analysts, and educators. With DataViz Pro, users can easily upload their data and create stunning visual representations without needing any coding skills.
The platform features a user-friendly interface that simplifies the visualization process. Key highlights include a natural language query system, real-time data updates, and a variety of customizable chart types. Users can collaborate seamlessly with team members, ensuring that insights are shared efficiently. DataViz Pro stands out for its robust analytics capabilities, allowing users to derive meaningful insights from their data.
While DataViz Pro offers a free trial for new users, its subscription plans unlock advanced features and unlimited access to visualization tools. Some users may find that they need more flexibility in design options. If you are considering your options, exploring alternatives to DataViz Pro could lead you to tools that better meet your unique needs.

Vibechart AI
Free
AI Data Management
VibeChart is an innovative AI-driven data visualization tool that simplifies the process of turning raw data into visually appealing charts and diagrams. It is perfect for a diverse audience, including business analysts, researchers, marketers, and educators. With VibeChart, users can effortlessly upload their data and generate insightful visuals that are easy to interpret and share.
The platform boasts an intuitive interface, making it accessible even for those without technical expertise. Key features include a text-to-chart interface, built-in data cleaning, and over 40 chart types. Users can also enjoy real-time collaboration, flexible data import options, and one-click export capabilities. VibeChart stands out with its advanced natural language processing, allowing for easy customization of visualizations.
While VibeChart offers a free plan for creating up to 10 charts, paid plans provide additional features and unlimited chart creation. Although it has many strengths, some users may seek more advanced customization options. If you are exploring your choices, considering alternatives to VibeChart may uncover tools that align better with your specific requirements.

Columns AI
Paid Plan - from $$79
AI Data Management
Columns AI is a dynamic data visualization platform powered by artificial intelligence. It allows users to transform raw data into engaging visual narratives effortlessly. This tool is designed for everyone, from data analysts to educators, making data storytelling accessible to all. With its intuitive interface, users can create, customize, and share visualizations without needing technical skills.
Key features include natural language processing, real-time data integration, and customizable templates. These capabilities enable users to generate insightful visuals quickly. The platform also supports collaborative sharing, allowing teams to work together seamlessly. Scheduled refreshes ensure that visualizations are always up to date, while multi-source support broadens data integration options.
Columns AI is available for a one-time payment of $79, providing lifetime access without recurring fees. While it offers many advantages, some users may find it lacks advanced features compared to traditional business intelligence tools. If you are considering your options, exploring alternatives to Columns AI could lead you to solutions that better meet your specific needs and budget.

Databricks
Paid Plan - from $$0.07
AI Data Management
DataRobot is a powerful AI platform designed to simplify the machine learning process for users of all skill levels. It enables data scientists, business analysts, and organizations to build, deploy, and manage machine learning models efficiently. With its automated machine learning capabilities, DataRobot streamlines the model development process, allowing users to focus on insights rather than technical complexities.
Key features of DataRobot include an intuitive user interface, automated feature engineering, and model selection. Users can easily upload datasets and receive actionable insights without extensive coding knowledge. The platform supports various data types and integrates seamlessly with popular data sources, enhancing its versatility. Additionally, DataRobot offers robust collaboration tools, making it easy for teams to work together on projects.
While DataRobot provides a comprehensive solution, its pricing can be a consideration for smaller teams. Exploring alternative platforms may uncover options that better suit your budget and specific needs. Consider evaluating other tools to find the ideal match for your machine learning projects and objectives.

Morphdb IO
Free
AI Data Management
Morphdb IO is an innovative AI-driven platform designed for effortless data analysis and visualization. It empowers users to import, manage, and analyze data from multiple sources without requiring any coding skills. This makes it an excellent choice for data analysts, business leaders, marketers, and engineers who need quick insights and effective data management.
Key features of Morphdb IO include a no-code interface, real-time collaboration, and customizable dashboards. Users can easily integrate various data sources, ensuring a comprehensive view of their information. The platform also offers automated reporting, enhancing efficiency and saving valuable time. Its user-friendly design caters to individuals with different technical backgrounds.
Morphdb IO provides a free plan with essential features, making it accessible for small teams and individual users. For those needing advanced functionalities, paid plans are available. While Morphdb IO excels in many areas, exploring alternative tools might reveal options that better align with your specific requirements or budget. Consider looking into other platforms to find the best fit for your data analysis needs.

Blazordata Net
Free
AI Data Management
BlazorData Net is a versatile, open-source desktop application designed for personal data management and analysis. Built on Blazor Hybrid and .NET, it prioritizes user privacy by storing data locally on devices. This tool is perfect for data analysts, privacy-conscious users, developers, and small business owners seeking a secure and efficient way to handle their data.
Key features include the ability to import data from multiple sources, AI-driven data transformation, and comprehensive reporting tools. Its user-friendly interface makes it accessible for users of all skill levels. BlazorData Net stands out with its emphasis on local computation, eliminating reliance on cloud services. This ensures that sensitive information remains secure and private.
While BlazorData Net is completely free, it is limited to Windows and Mac operating systems and requires local installation. Users may find the learning curve steep for some advanced features. If you are interested in BlazorData Net, consider exploring other alternatives that might offer different functionalities or pricing structures to suit your needs better.

Nightfall AI
Paid Plan - Custom
AI Data Management
Nightfall AI is an innovative data loss prevention platform that utilizes artificial intelligence to protect sensitive information across various applications. It is ideal for enterprises, security teams, compliance officers, and IT administrators who require robust data security solutions. Nightfall AI excels in real-time monitoring, machine learning detection, and automated remediation, ensuring that data is safeguarded effectively.
What makes Nightfall AI stand out is its user-friendly interface and advanced machine learning models. The platform offers pre-built detectors and the ability to create custom detectors, making it adaptable to various organizational needs. Its seamless integration with popular SaaS applications enhances usability and efficiency. Nightfall AI provides detailed reporting, allowing users to make informed decisions regarding data protection.
While Nightfall AI does not offer a free plan, pricing is available upon request, catering to both small businesses and large enterprises. If you find Nightfall AI intriguing, consider exploring alternatives that may offer different features or pricing options to better align with your specific requirements.

Labellerr
Free
AI Data Management
Labellerr is an innovative AI-powered data labeling platform that simplifies the annotation process for diverse data types, including images, videos, text, audio, and PDFs. It is designed for AI and machine learning developers, data scientists, businesses, and researchers who require efficient and accurate data preparation for their projects. By combining advanced automation with human-in-the-loop quality assurance, Labellerr enhances both speed and precision in dataset preparation.
What makes Labellerr stand out is its user-friendly interface and robust features. Key offerings include automated labeling, multi-data type support, and smart quality assurance. The platform also integrates seamlessly with popular MLOps tools, making it easier to manage projects. Labellerr provides a free Researcher Plan, ideal for students and academics, while paid plans cater to larger teams and enterprises with extensive needs.
Pricing options are flexible, ranging from free to custom enterprise solutions. If Labellerr piques your interest, consider exploring alternatives that may offer different functionalities or pricing models to better fit your requirements.

Superjoin AI
Free
AI Data Management
Superjoin AI is a powerful tool designed to optimize productivity in Google Sheets. This AI-driven assistant automates data integration, transformation, and analysis, making it accessible for users without extensive technical skills. It is perfect for data analysts, sales teams, marketing departments, and financial analysts who need to manage complex datasets efficiently.
What sets Superjoin AI apart is its user-friendly interface and advanced AI technology. Key features include automated data refresh, intelligent data transformation, and visual data tools. Users can also take advantage of alerts and collaboration features, enhancing team productivity. The tool supports integration with various data sources, ensuring seamless workflow management.
Superjoin AI offers a free plan for occasional users, while paid plans provide more advanced features for regular data needs. Pricing options range from $59 to $75 per month, catering to different usage levels. If you are considering Superjoin AI, it may be worthwhile to explore alternatives that could offer unique features or pricing structures better suited to your specific needs.

Extend App
Paid Plan - Custom
AI Data Management
Extend is a cutting-edge AI platform that transforms document processing by utilizing advanced Large Language Models. It excels at extracting, classifying, and splitting data from complex files like PDFs and scans with over 95% accuracy. This capability allows teams to automate workflows efficiently, making it a valuable asset for various industries. Financial institutions, healthcare providers, logistics companies, and human resources departments can all benefit from its powerful features.
What sets Extend apart is its intuitive interface and rapid deployment, enabling users to get started quickly. The platform supports multimodal processing, which means it can handle diverse document types, including those with tables and handwriting. Additionally, it offers custom fine-tuning options to adapt to specific organizational needs. While Extend does not provide a free plan, its pricing is tailored to fit the scale and requirements of each organization.
If you are considering Extend, it may be worthwhile to explore alternatives that could offer different features or pricing structures better suited to your needs.

Capeprivacy
Free
AI Data Management
CapePrivacy is a cutting-edge AI platform designed to prioritize data privacy and security for users handling sensitive information. Ideal for enterprises, financial institutions, healthcare providers, and legal firms, it enables secure interactions with advanced language models like ChatGPT. By automatically encrypting and redacting confidential data, CapePrivacy ensures compliance with stringent privacy standards.
What sets CapePrivacy apart is its robust feature set, including data encryption, optical character recognition, and voice capabilities. Users can also benefit from a Non-Disclosure Agreement feature, which helps establish secure relationships. The platform supports multiple file types, making it versatile for various applications. Its user-friendly interface simplifies the experience, allowing both technical and non-technical users to navigate easily.
CapePrivacy offers both free and paid plans, with the free version providing 250,000 seconds of compute time monthly. While the paid plans unlock additional features, some users may find the pricing a factor to consider. If you are evaluating CapePrivacy, exploring alternatives could help you find a solution that better fits your specific requirements and budget.

Minusx AI
Free
AI Data Management
MinusX AI is an innovative data assistant that leverages artificial intelligence to enhance data analysis for users in various sectors. It is especially useful for data analysts, business intelligence teams, and organizations using platforms like Metabase, Jupyter, or Tableau. With MinusX AI, users can conduct complex data analyses using natural language queries, making data insights accessible to both technical and non-technical individuals.
The tool stands out with its seamless integration capabilities, allowing users to connect effortlessly with existing analytics platforms. Key features include real-time data analysis, customizable dashboards, and a user-friendly interface designed for ease of use. Additionally, MinusX AI provides 24/7 support, ensuring users receive assistance whenever needed.
While MinusX AI offers a free plan for occasional users, its paid options provide more extensive features. However, some users may find the pricing a consideration. If you are exploring MinusX AI, it may be beneficial to look into alternatives that could better align with your specific needs and budget. Discovering other options could lead you to the ideal data analysis solution for your organization.

Displayr
Free
AI Data Management
Displayr is a powerful AI-driven platform that simplifies data analysis and reporting for users across various industries. It is particularly beneficial for market researchers, data analysts, and business intelligence teams who need to transform complex datasets into meaningful insights. Displayr allows users to connect multiple data sources, perform advanced statistical analyses, and create visually appealing reports with ease.
One of its standout features is the integration of AI capabilities, which enhances the speed and accuracy of data interpretation. Users can enjoy automated reporting, interactive dashboards, and customizable visualizations, all within a user-friendly interface. The platform also emphasizes collaboration, making it easy for teams to work together on projects.
While Displayr operates on a subscription basis, it offers a free trial, allowing potential users to explore its features before committing. However, some may find the pricing a barrier. If you are considering Displayr, it may be worthwhile to explore alternatives that could better suit your needs and budget. Discovering other options might lead you to the perfect data analysis tool for your requirements.

Zeit-AI
Paid Plan - Custom
AI Data Management
Zeit AI is an innovative data analysis platform designed to empower users to extract insights from their data using natural language queries. This tool is perfect for data analysts, business managers, and consultants who seek to simplify complex data interactions without needing coding expertise. Zeit AI transforms intricate datasets into clear, actionable insights, making it accessible for users at all skill levels.
Key features include seamless data integration, real-time analytics, and customizable dashboards, all housed within a user-friendly interface. The platform prioritizes data security and compliance, ensuring that sensitive information is protected. Its explainable AI responses help users understand the reasoning behind data interpretations, enhancing trust in the results.
While Zeit AI does not offer a free plan, potential users can inquire about pricing options tailored to their needs. The absence of a free trial may deter some, but the advanced capabilities make it a strong contender in the market. However, exploring alternatives could uncover other tools that better fit your specific requirements or budget. Consider looking into different options to find the best data analysis solution for you.

Fabi AI
Free
AI Data Management
Fabi AI is a cutting-edge data analysis platform that leverages AI to simplify and enhance data workflows. It is particularly beneficial for data analysts, business intelligence teams, and product managers who need quick insights without extensive coding. Fabi AI allows users to conduct ad hoc analysis, create dashboards, and automate reporting, making data handling more efficient and accessible.
One of its standout features is the integration of SQL and Python, which enables users to connect various data sources effortlessly. The platform also offers real-time collaboration, allowing teams to work together seamlessly. With a user-friendly interface, even those with limited technical skills can navigate the tool easily.
Fabi AI operates on a subscription model, starting with a free trial that provides basic features. For full access, users can choose from various pricing plans, including a Pro Plan at $29 per month. While Fabi AI excels in data automation, it is beneficial to explore alternatives that may align better with your specific needs or budget. Considering other options can lead you to the ideal data analysis solution.

Datumfuse AI
Free
AI Data Management
DatumFuse.AI is a cutting-edge platform that automates data cleaning, harmonization, and visualization. Designed for users across various industries, it transforms messy spreadsheets and CSV files into organized datasets and insightful visualizations in just minutes. This tool is ideal for marketing analysts, business analysts, and operations teams who require efficient data preparation.
One of DatumFuse.AI's key features is its automated data cleaning, which significantly reduces manual effort and errors. The AI-powered harmonization feature ensures that datasets are consistent and ready for analysis. Users can also benefit from automated data visualization and AI-generated narratives, making it easier to present findings clearly. The platform supports multiple file formats, including CSV, Excel, and Google Sheets, enhancing its versatility.
Currently in a free Public Beta phase, DatumFuse.AI allows users to explore its capabilities at no cost. While it excels in automation and user-friendliness, some may prefer alternatives that offer different functionalities or pricing models. Considering other options may help you discover the best fit for your data preparation needs.

Unwrap AI
Paid Plan - Custom
AI Data Management
Unwrap.ai is a powerful AI-driven feedback analytics platform that specializes in transforming unstructured customer data into valuable insights. Utilizing advanced natural language processing, it analyzes feedback from various sources, such as support chats, app store reviews, and surveys. This capability allows businesses to swiftly identify trends and customer sentiments, leading to informed decision-making that enhances product development and customer satisfaction.
Unwrap.ai is particularly beneficial for product managers, customer success teams, marketing professionals, and data analysts. Its key features include automated feedback categorization, real-time anomaly detection, and customizable dashboards. The platform also ensures data security compliance, making it a reliable choice for organizations of all sizes. Its user-friendly interface allows users to easily navigate and extract insights without extensive technical knowledge.
While Unwrap.ai does not offer a free plan, it provides custom pricing tailored to organizational needs. If you find that Unwrap.ai may not fully meet your requirements, consider exploring alternative tools that could better suit your specific feedback analysis needs.

Chatcsv Co
Free
AI Data Management
ChatCSV is an innovative tool designed to revolutionize how users interact with their CSV data. By transforming traditional data analysis into engaging conversations, it allows users to ask questions and receive visual insights seamlessly. This makes it an ideal choice for data analysts, business managers, marketing teams, and financial experts who need quick and actionable insights.
One standout feature of ChatCSV is its conversational interface, which simplifies complex data queries. Users can upload CSV files and engage in dialogue, making data analysis more intuitive. The tool also offers automated question generation and flexible data visualization options, enhancing the user experience. Its user-friendly design ensures that both novices and seasoned professionals can navigate it easily.
ChatCSV provides a free plan, making it accessible for individuals and small teams. Paid plans offer enhanced features for more demanding users. While ChatCSV excels in its niche, exploring alternatives may reveal tools with broader capabilities or different pricing models that better meet your requirements. Consider evaluating other options to find the best fit for your data analysis needs.
Categoraize Io
Free
AI Data Management
Categoraize.io is an innovative AI-driven platform designed for efficient data organization. It automates the categorization of texts, URLs, images, and documents into custom or hierarchical categories. By leveraging advanced large language model technologies, Categoraize.io assigns categories based on content without requiring pretraining or predefined labels. This flexibility allows users to define their own categories or let the AI generate them, making it suitable for various data management needs.
The platform is particularly beneficial for data analysts, content managers, software developers, and product managers who require structured data for analysis and decision-making. Its user-friendly interface is accessible via a browser, REST API, or plugins, catering to diverse workflows and integration requirements. Key features include automated data categorization, customizable categories, and multi-level hierarchies, which enhance data organization.
While Categoraize.io offers a free plan, users may want to explore paid options for extended features. If you are considering data categorization tools, looking into alternatives to Categoraize.io could reveal solutions that align better with your specific needs and budget.

Baselinetrials
Paid Plan - Custom
AI Data Management
Baseline AI is a cutting-edge tool designed to streamline document creation and data management for clinical trials. It is particularly beneficial for clinical research organizations, pharmaceutical companies, biotech startups, and academic institutions. By automating these processes, Baseline AI helps users save time and reduce operational costs while enhancing data accuracy.
One of its key features is automated document creation, which simplifies the often complex paperwork involved in clinical trials. The platform also offers AI-powered analytics and real-time collaboration tools, making it easier for teams to work together efficiently. Its user-friendly interface ensures that even those with limited technical skills can navigate the system with ease.
While Baseline AI does not provide a free plan, interested users can contact the company for detailed pricing information. Although it excels in trial automation, potential users might want to explore alternatives that offer different functionalities or pricing models. Considering other options can help you find the most suitable tool for your clinical research needs and improve your overall trial management experience.
Pdfpals
Paid Plan - from $29
AI Data Management
PDF Pals is a cutting-edge macOS application designed to transform how users engage with PDF documents. This tool is ideal for researchers, legal professionals, software developers, and consultants who need efficient document analysis without the burden of manual reading. PDF Pals streamlines the extraction of vital information, making it easier to process complex documents.
One of its key features is the advanced OCR engine, which supports scanned PDFs and intricate forms. The intuitive chat interface enhances user interaction, allowing for seamless communication with the tool. Additionally, PDF Pals prioritizes user privacy by processing data locally, ensuring that sensitive information remains secure. With no file size limits, users can work with extensive documents without restrictions.
PDF Pals operates on a one-time payment model, offering lifetime access without ongoing fees. While it is currently available only for macOS, users seeking different functionalities or platforms may want to explore alternatives. Consider looking into other tools that might better align with your specific needs and preferences for PDF management.
Bulk-Rename-Utility
Free
AI Data Management
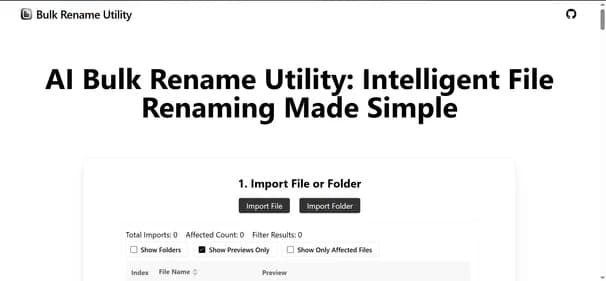
Bulk Rename Utility is a versatile online tool designed to simplify the process of renaming multiple files at once. Ideal for photographers, business professionals, and media managers, it allows users to efficiently organize their files without hassle. This tool operates directly in web browsers, making it accessible on both Windows and Mac systems.
One of its key features is the combination of AI-driven and rule-based renaming methods. Users can perform everything from simple name changes to complex regex replacements. The platform emphasizes user privacy by processing files locally, ensuring that sensitive information remains secure. Additionally, Bulk Rename Utility supports custom JavaScript implementations, giving users flexibility in their renaming tasks.
While it offers a free version with robust features, it lacks offline capabilities and mobile app support. If you are exploring file renaming solutions, consider looking into alternatives that might offer additional features or different pricing structures. Exploring other options could lead you to a tool that better fits your specific requirements.
Localfile Io
Free
AI Data Management
LocalFile.io is an innovative AI-powered tool designed to make bulk file renaming a breeze directly from your browser. This tool is perfect for photographers, content creators, data analysts, and IT professionals who need to manage large collections of files efficiently. With LocalFile.io, you can rename multiple files simultaneously, saving you time and effort.
One of its standout features is the user-friendly interface, which simplifies the renaming process. The tool operates entirely in your browser, eliminating the need for installation. Additionally, it prioritizes user privacy, ensuring that your files are not uploaded during processing. LocalFile.io offers a free version for online use and a one-time purchase option for an executable file, providing lifetime access for just $5.
While LocalFile.io excels in bulk renaming, it is currently limited to Windows OS and lacks broader file management features. If you are considering file renaming tools, exploring alternatives may help you find a solution that better meets your specific needs. Take the time to look into other options available in the market.
Ledgerbox Io
Free
AI Data Management
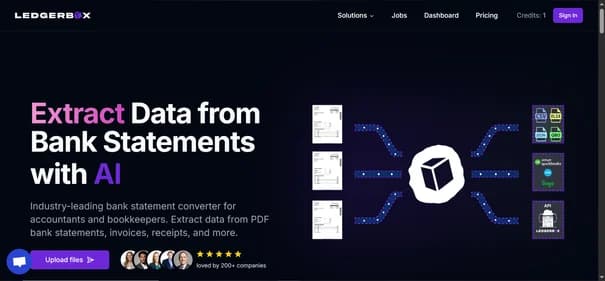
LedgerBox is an innovative AI tool designed to automate the conversion of financial documents into structured formats like Excel and CSV. This tool is perfect for accountants, bookkeepers, small business owners, and financial analysts who want to streamline their data extraction processes. By utilizing advanced AI and computer vision technologies, LedgerBox significantly reduces manual data entry, enhancing accuracy and efficiency.
What sets LedgerBox apart is its user-friendly interface and high-performance capabilities. Users can benefit from automated data extraction, multi-format conversion, and seamless integration with QuickBooks. The tool also supports batch processing, making it ideal for accounting firms handling multiple clients. With a free account option that allows for ten page conversions, users can test the service before committing.
While LedgerBox offers impressive features, exploring alternatives may uncover tools that better suit your specific requirements or budget. Other platforms might provide unique functionalities or different pricing structures that could enhance your financial document management. Consider taking the time to evaluate various options to find the best solution for your needs.
Html Zone
Free
AI Data Management
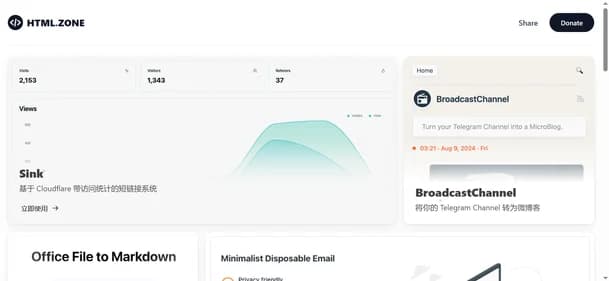
HTML Zone is a versatile web-based tool suite designed to simplify various online tasks for developers and everyday users. This platform offers essential utilities such as background removal, domain and IP lookup, WHOIS information, and URL shortening. Its user-friendly interface allows quick access to all features without the need for installation, making it perfect for those seeking efficient solutions.
HTML Zone stands out with its cloud-based performance, ensuring reliability and speed. Most tools are available for free, making it an accessible choice for anyone needing quick tech solutions. Whether you are a web developer, content creator, or digital marketer, HTML Zone caters to a wide range of needs. The platform consolidates multiple utilities in one place, enhancing convenience for users.
While HTML Zone excels in providing essential web tools, you may want to explore alternatives that offer more specialized features or different pricing models. Other options might include advanced editing capabilities or additional integrations. As you consider your choices, take the time to explore various alternatives to find the best fit for your online tasks.
Wideanglesoftware
Free
AI Data Management
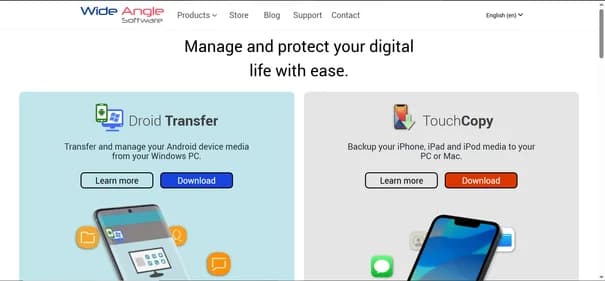
Wide Angle Software is a versatile media management tool designed for users who need to organize and protect their digital files. Founded in 2006, this UK-based company offers solutions like TouchCopy, Droid Transfer, and Tune Sweeper, catering to both iOS and Android users. It is ideal for anyone looking to streamline their media management, from casual users to music enthusiasts.
The software features a user-friendly interface that simplifies tasks like transferring files and cleaning up music libraries. Its standout capabilities include seamless device synchronization and effective media organization, making it a reliable choice for managing digital content. Wide Angle Software also provides free trials, allowing users to test functionality before committing to a purchase.
While it offers robust features, some users may find pricing higher compared to competitors. Additionally, not all products may support the latest device models immediately. If you are considering media management tools, exploring alternatives could lead you to options that better suit your needs or budget. Take the time to evaluate other solutions available in the market.
ChatData
Free
AI Data Management
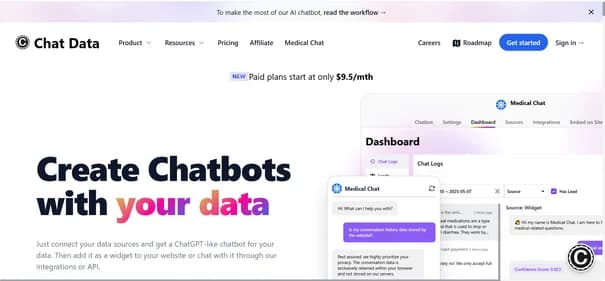
ChatData is an AI-powered analytics tool that makes analyzing spreadsheet data in a conversational format simple and fast. Users can upload CSV or Excel files and type natural language queries, receiving instant insights without the need for complex BI software or manual formulas, thanks to large language models and chart generation AI.
The platform summarizes data in real-time, highlights trends, and generates professional charts suitable for presentations. Business owners can quickly understand sales and customer reports, analysts can automate routine reporting, and students can gain rapid insights for projects.
After a free trial, paid plans start at $10/month, unlocking unlimited queries and chart exports. The chat-based interface is intuitive, requiring no technical expertise.
ChatData is affordable for startups and small teams, though for advanced integrations or handling more complex datasets, exploring alternative tools may be beneficial.
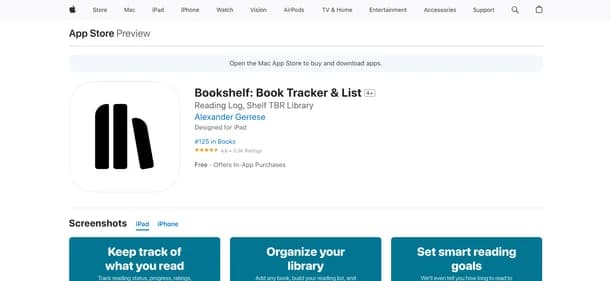
Bookshelf
Paid Plan - From $5.99
AI Data Management
Bookshelf is an AI-powered book tracking and library management app designed for readers to easily catalog their collections and track reading habits. Whether you're managing 10 books or 10,000, the platform offers powerful features like barcode scanning, customizable shelves, reading stats, and notes. Bookshelf provides a seamless experience for readers to monitor progress, set personalized reading goals, and discover new titles.
With its intuitive, sleek interface, Bookshelf is ideal for anyone—from casual readers to serious bibliophiles—looking to organize their collection digitally. Users can tag books, rate them, and add detailed notes, offering a more personalized library experience. The platform also supports cloud syncing, allowing access across devices.
Bookshelf Gold unlocks advanced features such as unlimited shelves, custom metadata, and priority syncing. It’s a flexible tool for readers, students, librarians, and bloggers looking for an efficient way to manage their books.
Bookshelf offers a free version with essential features, while premium plans start at $5.99/month. For those looking for alternatives, other library management tools may offer different organizational structures and features.

Bitskout
Free
AI Data Management
Bitskout is an innovative AI platform designed to streamline data extraction from various sources, including documents, emails, and images. Its no-code plugin creation feature allows users to integrate seamlessly into existing workflows, making it ideal for businesses across multiple sectors. Accounting professionals, HR teams, supply chain managers, and customer support departments can all leverage Bitskout to enhance efficiency and accuracy in their operations.
What makes Bitskout stand out is its user-friendly interface and real-time data processing capabilities. The platform supports integration with popular tools like Asana, Monday.com, and Zapier, ensuring a smooth transition into your current systems. Users can also benefit from customizable templates tailored to their specific needs. While Bitskout offers a free trial with 50 plugin runs, its pricing plans cater to various business sizes, from solo entrepreneurs to large enterprises.
If you are exploring Bitskout, consider looking into alternatives that might provide different functionalities or pricing options that better align with your requirements.
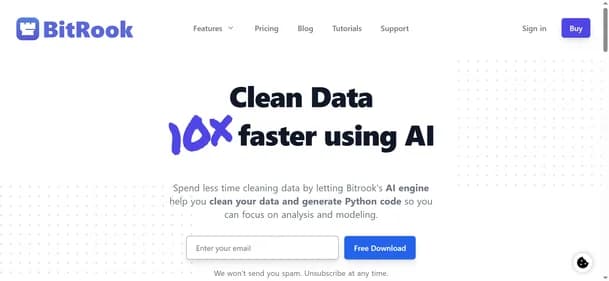
BitRook
Free
AI Data Management
BitRook is a desktop-based, AI-driven data cleaning tool. It simplifies and accelerates data preparation using machine learning algorithms. The platform profiles datasets, identifies issues, and recommends cleaning solutions. Its intuitive, no-code interface makes it accessible for various users. BitRook can detect data types, handle PII, and generate tailored Python scripts.
It is ideal for data analysts, data scientists, business intelligence professionals, and compliance officers. Key features include AI-powered data profiling, automatic data type detection, and no-code recommendations. BitRook also offers PII detection, predictive power scoring, and correlation analysis. Its on-premise processing ensures data privacy, which is crucial for sensitive information.
What makes BitRook stand out is its emphasis on data privacy through on-premise processing. While a free download provides core functionalities, paid plans offer advanced features. For those exploring alternatives, many other AI data cleaning tools exist. Consider options like Trifacta, OpenRefine, or DataRobot for varying levels of automation and integration. Users seeking different data preparation capabilities should explore these alternative AI solutions.
Athena Search
Paid Plan - Custom
AI Data Management
Athena Search is an AI-powered search and analytics platform designed to make handling large datasets more efficient. By combining natural language processing, predictive analytics, and advanced machine learning, it helps businesses retrieve information quickly and uncover meaningful insights. Instead of relying on manual queries or complex database processes, Athena Search streamlines data management and ensures decision-makers have access to relevant, timely results.
The platform is especially useful for data analysts, marketing teams, and business intelligence professionals who need to extract patterns and make data-driven decisions. Features like customizable search filters, query optimization, automated data tagging, and visual dashboards simplify the way teams interact with data. Athena Search integrates seamlessly with multiple sources such as CRMs and enterprise databases, allowing organizations to centralize and analyze information in one place. This makes it a practical choice for businesses of all sizes looking to optimize workflows and enhance reporting.
Although Athena Search provides strong capabilities, it does not offer a free plan and requires tailored pricing. For organizations exploring AI-driven search and analytics platforms, it is worth comparing alternatives to Athena Search before choosing the right solution.